- play_arrow Introduction
- play_arrow Overview
- play_arrow Access and Manage Paragon Automation Account
-
- play_arrow Administration
- play_arrow Introduction
- play_arrow Organization Management
- play_arrow Site Management
- play_arrow User Management
- play_arrow Inventory Management
- play_arrow Audit Logs
- play_arrow Tags
-
- play_arrow Device Life Cycle Management
- play_arrow Introduction
- play_arrow Day-Wise Activities for Device Life Cycle Management
- play_arrow Field Technician User Interface
- play_arrow Onboarding Profiles
- play_arrow Plan Device Onboarding
- Network Implementation Plan Overview
- About the Network Implementation Plan Page
- Allocate a Device as a Resource
- Add Network Resource Pools
- Add a Network Implementation Plan
- Publish a Network Implementation Plan
- Offboard a Network Implementation Plan
- Edit a Network Implementation Plan
- Update the Network Implementation Plan and Recreate Service Instances After Upgrade
- View Network Resources
- play_arrow View Device Onboarding
- About the Onboarding Dashboard
- Move a Device to Production
- View Results of Automated Device Tests
- Identity and Location Data of a Device
- Remote Management Data and Test Results
- Hardware Data and Test Results
- Interfaces Data and Test Results
- Software Data and Test Results
- Configuration Data and Test Results
- Routing Data and Test Results
- Device Connectivity Data and Tests Results
- play_arrow Device Management
- Device Management Workflow
- Device Licenses Overview
- About the Features Tab
- About the Licenses Tab
- Manage Device Licenses
- About the Software Images Page
- Upload a Software Image
- Delete a Software Image
- About the Configuration Backups Page
- Configuration Templates Overview
- About the Configuration Templates Page
- Add a Configuration Template
- Edit and Delete a Configuration Template
- Preview a Configuration Template
- Deploy a Configuration Template to a Device
-
- play_arrow Trust and Compliance
- play_arrow Introduction
- play_arrow Manage Trust Settings and Trust Scores
- Compliance Standards Overview
- About the Compliance Benchmarks Page
- About the Compliance Tailorings Page
- Example: Create a Tailoring Document for NTP Settings
- About the Compliance Checklist Page
- Add a Checklist Template
- Add Checklist for a Device
- Import Scans and Update Rule Results in a Checklist
- Trust Plans Overview
- About the Network Score Formula Page
- Trust Score Overview
- About the Network Score Page
- About the Snapshots Page
- Add a Snapshot for a Target
- play_arrow Manage Compliance Scans
- play_arrow Manage Vulnerabilities
- play_arrow Monitor Integrity
-
- play_arrow Service Orchestration
- play_arrow Introduction
- play_arrow View Service Design Catalog
- play_arrow Manage Customers
- play_arrow Add Resources for Network Services
- play_arrow Manage Service Instances
- Service Instance Overview
- About the Service Instances Page
- View Service Instance Details
- View Passive Assurance Monitoring Data
- View EVPN Passive Assurance Monitoring Results
- View L2 Circuit Passive Assurance Monitoring Data
- View L3VPN Passive Assurance Monitoring Results
- Physical Interfaces Health Check Results
- Logical Interfaces Health Check Results
- Performance Graphs to View Passive Assurance Monitoring Data
- play_arrow Provision VPN Services
- play_arrow Monitor Service Order Execution Workflows
-
- play_arrow Active Assurance
- play_arrow Introduction
- play_arrow Test Agents
- play_arrow Tests and Monitors
- play_arrow Test Templates
-
- play_arrow Paragon Shell CLI Reference
- play_arrow Introduction
- play_arrow Operational Mode Commands
- file copy
- monitor
- request paragon backup
- request paragon cluster pods reset
- request paragon cluster upgrade
- request paragon config
- request paragon deploy
- request paragon deploy cluster
- request paragon destroy cluster
- request paragon fix-permission
- request paragon load
- request paragon repair-node
- request paragon replace-node
- request paragon restore
- request paragon running-config
- request paragon ssh
- request paragon ssh-key
- request paragon storage cleanup
- request paragon super-user password reset
- request system decrypt password
- request system reboot
- show configuration paragon cluster
- show configuration paragon cluster applications (o)
- show configuration paragon cluster common-services (o)
- show host disk usage
- show paragon backup
- show paragon certificate expiry-date certificate-type
- show paragon cluster (o)
- show paragon cluster details
- show paragon cluster namespaces
- show paragon cluster nodes
- show paragon cluster pods
- show paragon cluster pods namespace healthbot sort
- show paragon images version
- show paragon images version namespace
- show paragon pvc details
- show paragon version
- play_arrow Configuration Mode Commands
- delete paragon cluster
- load set
- set paragon cluster applications
- set paragon cluster common-services ingress
- set paragon cluster insights victoria-metrics
- set paragon cluster install
- set paragon cluster kubernetes
- set paragon cluster mail-server
- set paragon cluster nodes
- set paragon cluster ntp
- set paragon cluster papi
- set paragon monitoring
- set system login
- show paragon cluster (c)
- show paragon cluster applications (c)
- show paragon cluster common-services ingress (c)
- play_arrow Troubleshooting Commands
- Troubleshoot Using the Paragon Shell CLI Commands
- request paragon support information
- request paragon troubleshooting information
- request paragon debug
- request paragon debug get-tsdb-data
- request paragon debug insights-kafka-data
- request paragon debug kafka
- request paragon debug logs
- request paragon debug logs namespace
- request paragon debug postgres
- request paragon debug redis
- play_arrow Service Orchestration
- About the Service Orchestration cMGD CLI
- set foghorn:core org-id
- set service design default version
- set dag state failed
- show service order status
- show service order as-json
- show service order as-yaml
- show service designs
- show device dependent configuration
- show insights configuration
- show configuration foghorn:customers
- show service instance lock status
- show service instance lock token
- show service projects
- show service order history
- show airflow dags
- show airflow dag-runs
- show paragon orgs
- request service project add
- request service order sync
- request network resources load
- request service order load
- request service order place
- request service order modify
- request service order delete
- request service order submit
- request service order provision
- request service design install
- request service design uninstall
- request create graphdb
- request service order set
- request service instance lock
- request service instance unlock
-
Network Visualization Options
To access the Topology page, select Observability > Network > Topology.
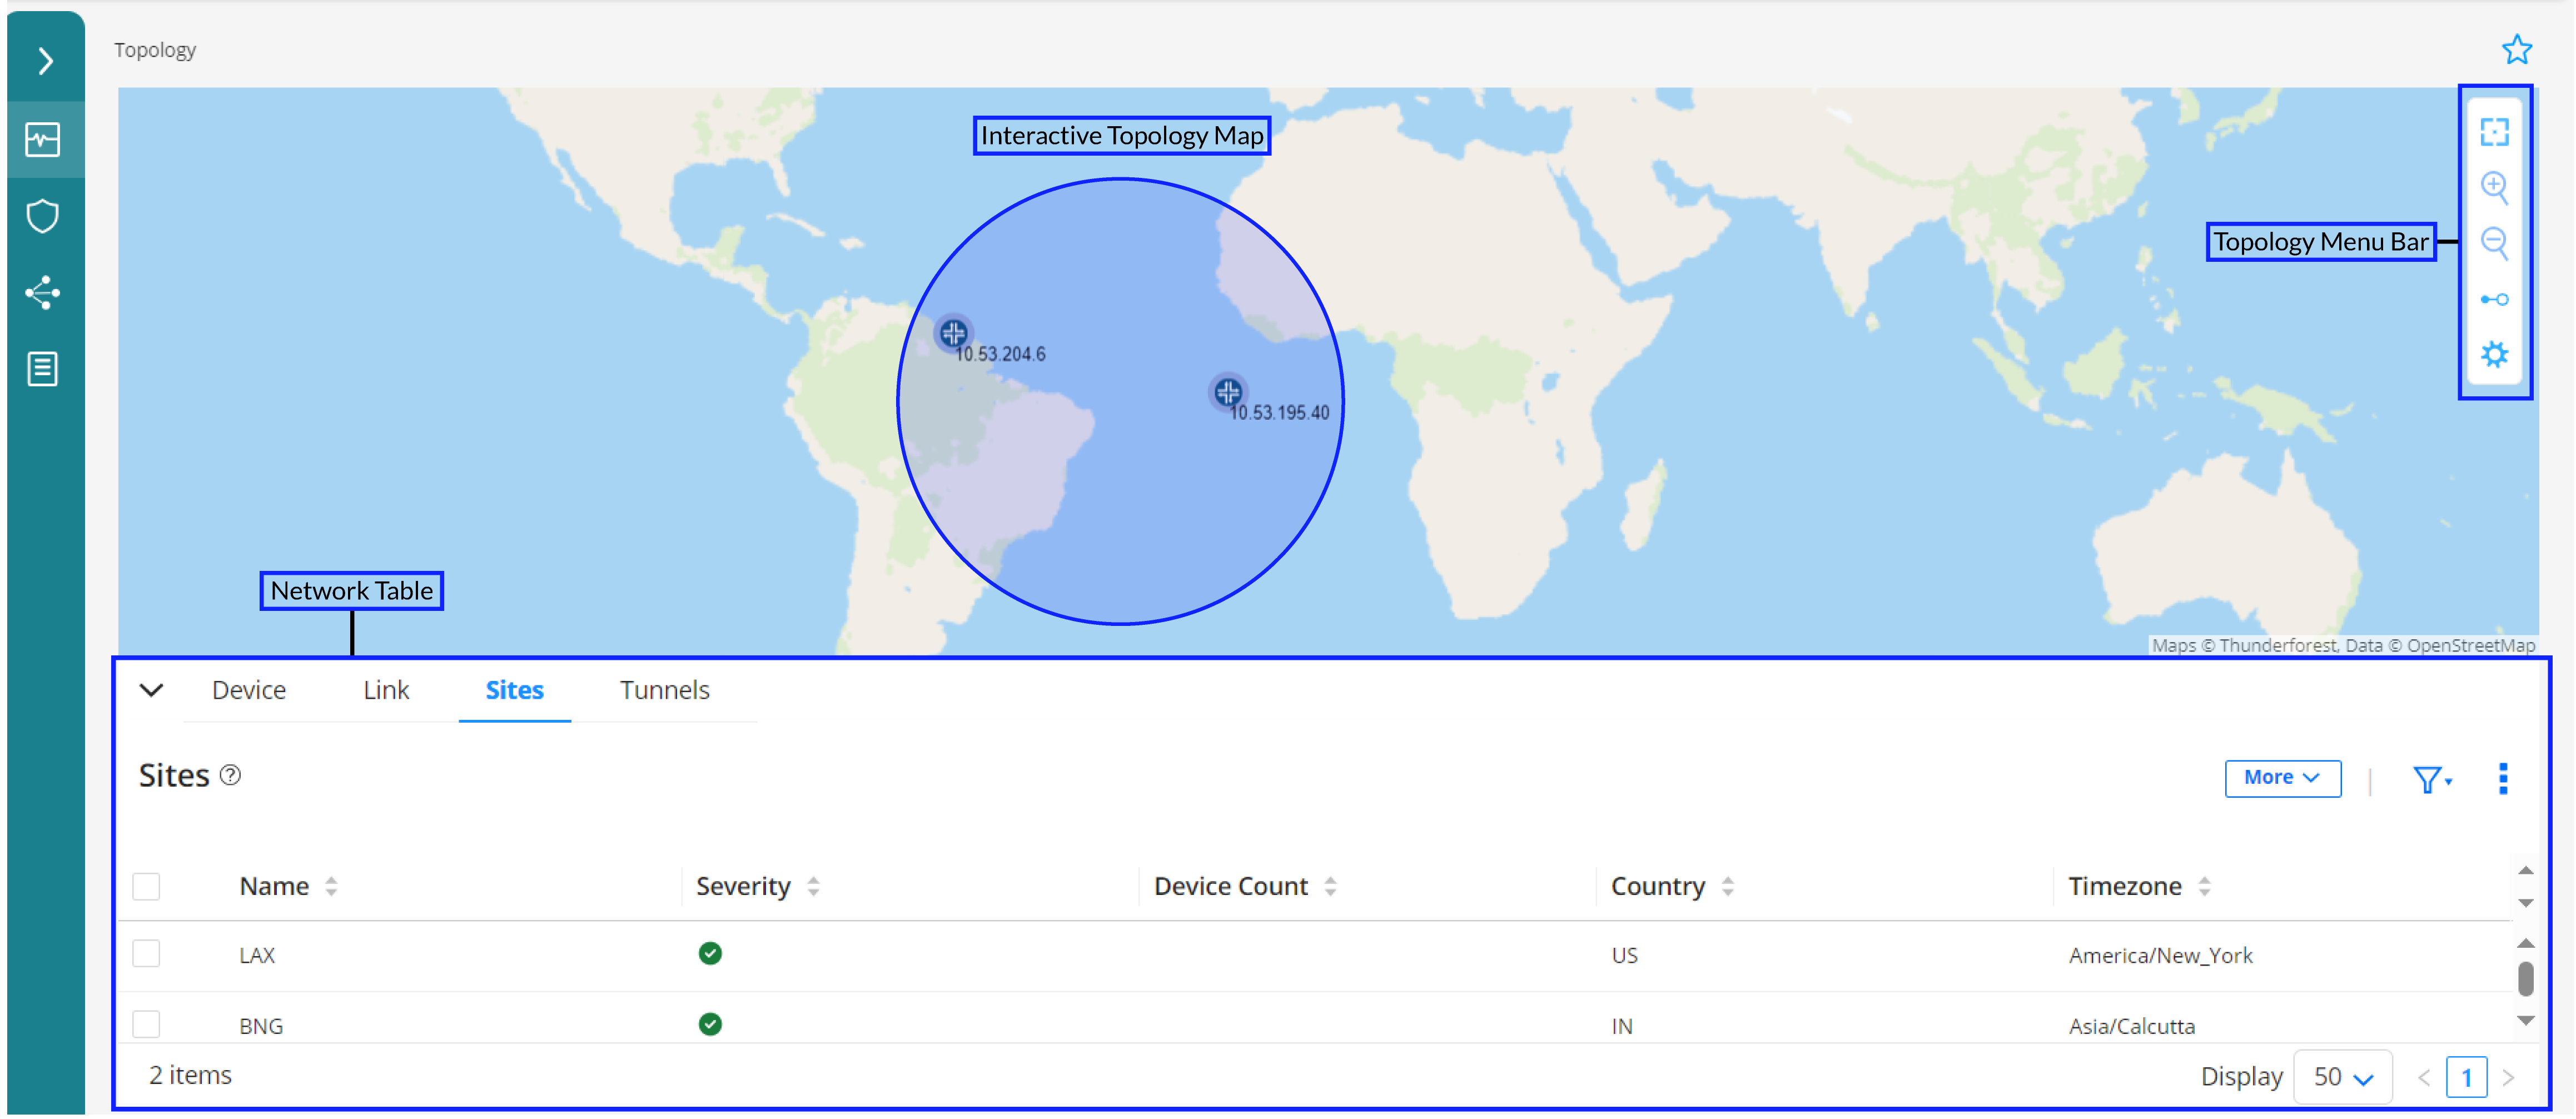
The Topology page displays the devices, links, sites, and tunnels in your network in graphical and tabular formats. Users with Super User, Network Admin, and Observer roles can monitor the WAN links through the interactive topology map that enables you to customize the view of devices and links across sites. The network table lists the devices, links, sites, and tunnels in your network topology.
The Topology page can be divided into three main components:
Interactive Topology Map—Enables you to view devices, links, and tunnels across sites in your network and customize the map display. Manage the map view, set device positions on the map, customize device and link labels and font size using the right click menu. For more information, see View Network Topology Details.
Topology Menu Bar—A vertical bar at the top-right corner of the Topology page, which consists of the following:
Reset icon—Center the topology map so that it zooms to fit the screen.
Plus icon—Zoom in (enlarge) the topology map.
Minus icon—Zoom out (reduce) the topology map.
Switch to Cluster View/Node View icon—Switch to Cluster View from the default Node View.
In the Node View, all devices are displayed. When devices and links are in proximity in the map, they may overlap with each other and clutter the map. To reduce clutter, you can switch to the Cluster View to collapse devices and links in the topology map into clusters and bundles, respectively. For more information, see Cluster View.
Settings icon—Configure display properties of the topology map. You can also specify the neighbor (peer) IP address and autonomous system (AS) number so that Paragon Automation can establish a BGP-LS peering session and enables you to view live changes in your network.
Network Table— Displays detailed information about network devices, links, sites, and tunnels. Click the collapsible arrow icon at the bottom-left of the topology map to display or hide the network table.
For more information, see Network Table Overview.
Figure 1 shows all the components in the Topology page.

Navigation in the Topology Page
Table 1 describes the navigation functions that you can use in the Topology page.
Function | Method |
---|---|
Drag and drop | Select an element, drag to the required position on the screen, and then release. |
Select an element | Click a link or device to select it. |
Select multiple elements | Do one of the following:
|
Zoom in and out ![]() | Do one of the following:
|
Reset topology view | Click the reset icon in the topology menu bar to resize and center the topology map to fit the visible area of the Devices & Links page. |
Right-click to access functions | Right-click any blank space in the topology map or on a map element to access context-specific menus. |
Collapse/expand pane ![]() | When a left, right, up, or down slider appears at the margin of a pane, you can click it to collapse or expand the pane. |
Pin ![]() | Click the pin icon on the top right of the page or widget to fix it at any place on the screen. |
Resize panes | Click and drag any of the pane margins to resize the panes. |