- play_arrow Getting Started
- play_arrow Blueprints
- play_arrow Staged Datacenter Blueprints
- play_arrow Physical
- play_arrow Build
- play_arrow Topology
- play_arrow Nodes
- Nodes (Datacenter)
- Create Access Switch
- Delete Node
- Update Deploy Mode (Datacenter)
- Unassign Device (Datacenter)
- Execute CLI Show Command (Data Center Blueprint)
- play_arrow Change Hostnames / Names
- Change Assigned Interface Map
- Change Assigned ASN (Datacenter)
- Change Assigned Loopback IP Address (Datacenter)
- Edit Device Properties (Datacenter)
- Update Port Channel ID Range
- View Node's Static Routes
- Update Tags on Node (Datacenter)
- play_arrow Generic Systems (Internal/External)
- play_arrow Links
- Links (Datacenter)
- play_arrow Add Links
- play_arrow Cabling Map
- play_arrow Link Speeds
- play_arrow LAG
- Update Tags on Link (Datacenter)
- Change Assigned Link IP Addresses (Datacenter)
- Update Link Properties
- Fetch LLDP Data (Datacenter)
- Delete Link (Datacenter)
- play_arrow Interfaces
- play_arrow Racks
- play_arrow Pods
- play_arrow Planes
-
- play_arrow Virtual
- play_arrow Virtual Networks
- What are Virtual Networks
- Create Virtual Network
- Update Virtual Network Resource Assignments
- Reset Virtual Network Resource Group Override
- Import Virtual Network
- Export Virtual Network to CSV File
- Update Virtual Network Assignments
- Move Virtual Network to Different Routing Zone
- Update Virtual Network Tags
- Change Virtual Network Description
- Change Virtual Network Details
- Delete Virtual Network
- play_arrow Routing Zones
- play_arrow Static Routes
- play_arrow Protocol Sessions
- play_arrow Virtual Infrastructure
-
- play_arrow Policies
- play_arrow Endpoints
- play_arrow Security Policies
- play_arrow Interface Policies
- play_arrow Routing Policies
- play_arrow Routing Zone Constraints
- play_arrow Tenants
-
- play_arrow Data Center Interconnect (DCI)
- play_arrow Integrated Interconnect
- play_arrow Over the Top or External Gateways
- play_arrow Settings
- Update ESI MAC msb
-
- play_arrow Catalog
- play_arrow Logical Devices
- play_arrow Interface Maps
- play_arrow Property Sets
- play_arrow Configlets
- play_arrow AAA Servers
- play_arrow Tags
-
- play_arrow Tasks
- play_arrow Connectivity Templates
- Connectivity Templates Introduction
- play_arrow Primitives
- Primitive: Virtual Network (Single)
- Primitive: Virtual Network (Multiple)
- Primitive: IP Link
- Primitive: Static Route
- Primitive: Custom Static Route
- Primitive: BGP Peering (IP Endpoint)
- Primitive: BGP Peering (Generic System)
- Primitive: Dynamic BGP Peering
- Primitive: Routing Policy
- Primitive: Routing Zone Constraint
- User-defined
- Pre-defined
- Create Connectivity Template for Multiple VNs on Same Interface (Example)
- Create Connectivity Template for Layer 2 Connected External Router (Example)
- Update Connectivity Template Assignments
- Add / Remove Tags on Connectivity Template
- Update Connectivity Template
- Delete Connectivity Template
- play_arrow Fabric Settings
- play_arrow Fabric Policy
- play_arrow Severity Preferences
-
-
- play_arrow Staged Freeform Blueprints
- Freeform Introduction
- play_arrow Blueprints
- play_arrow Physical
- play_arrow Selection
- play_arrow Topology
- play_arrow Systems
- Systems Introduction (Freeform)
- Create Internal System (Freeform)
- Create External System (Freeform)
- Update Assigned Config Template(Freeform)
- Update System Name (Freeform)
- Update Hostname (Freeform)
- Change Assigned Device Profile (Freeform)
- Update System ID Assignment (Freeform)
- Update Deploy Mode (Freeform)
- Add / Remove Tags on System (Freeform)
- Delete System (Freeform)
- Device Context (Freeform)
- play_arrow Links
-
- play_arrow Resource Management
- Resource Management Introduction (Freeform)
- play_arrow Blueprint Resources
- play_arrow Allocation Groups
- play_arrow Local Pools
- play_arrow Catalog (Freeform)
- play_arrow Config Templates
- play_arrow Device Profiles
- play_arrow Property Sets
- play_arrow Tags
-
- play_arrow Tasks
- play_arrow Uncommitted Blueprints
- play_arrow Active Datacenter Blueprints
- play_arrow Time Voyager (Blueprints)
- play_arrow Devices
- Device Configuration Lifecycle
- What are Managed Devices
- Add Managed Device
- Drain Device Traffic
- Upgrade Device NOS
- Device AAA
- play_arrow Device
- play_arrow Agent
- play_arrow Pristine Config
- play_arrow Telemetry
- play_arrow Apstra ZTP
- What is Apstra ZTP
- Create User Profile for Communicating with ZTP Server
- Download and Deploy Apstra ZTP Server VM
- Configure Static Management IP Address for Apstra ZTP Server
- Replace SSL Certificate for Apstra ZTP Server GUI
- Create Vendor-specific Custom Configuration
- Configure Credentials for Apstra ZTP Server GUI
- Configure Apstra Server Connection Details
- Configure DHCP Server for Apstra ZTP
- ztp.json Keys
- Configure ztp.json with Configurator
- Configure ztp.json with CLI
- Show Apstra ZTP Logs
- Onboard Devices with Apstra ZTP
- Check ZTP Status of Devices and Services
- Reset Apstra ZTP GUI Admin Password
- Authenticate User (AZTP REST API)
- play_arrow Device Profiles
- play_arrow Design
- play_arrow Logical Devices
- play_arrow Interface Maps
- play_arrow Rack Types
- play_arrow Templates
- play_arrow Config Templates (Freeform)
- play_arrow Configlets (Datacenter)
- play_arrow Property Sets (Datacenter)
- play_arrow TCP/UDP Ports
- play_arrow Tags
-
- play_arrow Resources
- play_arrow Analytics - Telemetry
- play_arrow Analytics - Flow
- play_arrow Apstra Flow Overview
- play_arrow Dashboards
- play_arrow Supported Flow Records
- play_arrow Flow Enrichment
- play_arrow Monitor Apstra Flow
- play_arrow Configuration Reference
- play_arrow API
- play_arrow Additional Documentation
- play_arrow Knowledge Base
-
- play_arrow Analytics - Exploratory Analytics
- play_arrow External Systems (RBAC Providers)
- play_arrow Providers
- play_arrow Provider Role Mapping
-
- play_arrow Platform
- play_arrow User Management
- play_arrow Security
- play_arrow External Services
- play_arrow Streaming
- Event Log (Audit Log)
- Licenses
- play_arrow Apstra VM Clusters
- play_arrow Developers
- play_arrow Technical Support
- Check Apstra Versions and Patent Numbers
-
- play_arrow Favorites & User
- play_arrow Apstra Server Management
- Apstra Server Introduction
- Monitor Apstra Server via CLI
- Restart Apstra Server
- Reset Apstra Server VM Password
- Reinstall Apstra Server
- Apstra Database Overview
- Back up Apstra Database
- Restore Apstra Database
- Reset Apstra Database
- Migrate Apstra Database
- Replace SSL Certificate on Apstra Server with Signed One
- Replace SSL Certificate on Apstra Server with Self-Signed One
- Change Apstra Server Hostname
- FIPS 140-2 Support
- play_arrow Apstra CLI Utility
- play_arrow Guides
- play_arrow References
- play_arrow Feature Matrix
- play_arrow Devices
- play_arrow Blueprint Analytics
- play_arrow Predefined Dashboards
- play_arrow Predefined Probes
- BGP Monitoring Probe
- Probe: Bandwidth Utilization
- Probe: Critical Services: Utilization, Trending, Alerting
- Probe: Device Environmental Checks
- Probe: Device System Health
- Probe: Device Telemetry Health
- Probe: Device Traffic
- Probe: Drain Traffic Anomaly
- Probe: ECMP Imbalance (External Interfaces)
- Probe: ECMP Imbalance (Fabric Interfaces)
- Probe: ECMP Imbalance (Spine to Superspine Interfaces)
- Probe: ESI Imbalance
- Probe: EVPN Host Flapping
- Probe: EVPN VXLAN Type-3 Route Validation
- Probe: EVPN VXLAN Type-5 Route Validation
- Probe: External Routes
- Probe: Hot/Cold Interface Counters (Fabric Interfaces)
- Probe: Hot/Cold Interface Counters (Specific Interfaces)
- Probe: Hot/Cold Interface Counters (Spine to Superspine Interfaces)
- Probe: Hypervisor and Fabric LAG Config Mismatch Probe (Virtual Infra)
- Hypervisor and Fabric VLAN Config Mismatch Probe
- Probe: Hypervisor MTU Mismatch Probe (Virtual Infra - NSX-T Only)
- Probe: Hypervisor MTU Threshold Check Probe (Virtual Infra)
- Probe: Hypervisor Missing LLDP Config Probe (Virtual Infra)
- Probe: Hypervisor Redundancy Checks Probe (Virtual Infra)
- Probe: Interface Flapping (Fabric Interfaces)
- Probe: Interface Flapping (Specific Interfaces)
- Probe: Interface Policy 802.1x
- Probe: LAG Imbalance
- Probe: Leafs Hosting Critical Services: Utilization, Trending, Alerting
- Probe: Link Fault Tolerance in Leaf and Access LAGs
- Probe: MAC Monitor
- Probe: MLAG Imbalance
- Probe: Multiagent Detector
- Probe: Optical Transceivers
- Probe: Packet Discard Percentage
- Probe: Spine Fault Tolerance
- Probe: Total East/West Traffic
- Probe: VMs without Fabric Configured VLANs Probe (Virtual Infra)
- Probe: VXLAN Flood List Validation
- play_arrow Probe Processors
- Processor: Accumulate
- Processor: Average
- Processor: BGP Session
- Processor: Comparison
- Processor: Environment
- Processor: EVPN Type 3
- Processor: EVPN Type 5
- Processor: Extensible Service Collector
- Processor: Generic Graph Collector
- Processor: Generic Service Data Collector
- Processor: Interface Counters
- Processor: Logical Operator
- Processor: MAC
- Processor: Match Count
- Processor: Match Percentage
- Processor: Match String
- Processor: Max
- Processor: Min
- Processor: Optical Threshold
- Processor: Optical Xcvr
- Processor: Periodic Average
- Processor: Periodic Change
- Processor: Range
- Processor: Ratio
- Processor: Service Collector
- Processor: Set Comparison
- Processor: Set Count
- Processor: Standard Deviation
- Processor: State
- Processor: Subtract
- Processor: Sum
- Processor: System Utilization
- Processor: Telemetry Service Health
- Processor: Time in State
- Processor: Traffic Monitor
- Processor: Union
- Processor: VXLAN Floodlist
- Configlet Examples (Design)
- Apstra EVPN Support Addendum
- Apstra Server Configuration File
- Graph
- Juniper Apstra Tech Previews
-
What are Probes
Probes are the basic unit of abstraction in Intent-Based Analytics. Generally, a given probe consumes some set of data from the network, does various successive aggregations and calculations on it, and optionally specifies some conditions of said aggregations and calculations on which anomalies are raised.
Probes are Directed Acyclic Graphs (DAGs) where the nodes of the graph are processors and stages. Stages are data, associated with context, that can be inspected by the operator. Processors are sets of operations that produce and reduce output data from input data. The input to processors are one-or-many stages, and the output from processors are also one-or-many stages. The directionality of the edges in a probe DAG represent this input-to-output flow.
Importantly, the initial processors in a probe are special and do not have any input stage. They are notionally generators of data. We shall refer to these as source processors.
IBA works by ingesting raw telemetry from collectors into probes to extract knowledge (ex: anomalies, aggregations and so on). A given collector publishes telemetry as a collection of metrics, where each metric has identity (viz, set of key-value pairs) and a value. IBA probes, often with the use of graph queries, must fully specify the identity of a metric to ingest its value into the probe. With this feature, probes can ingest metrics with partial specification of identity using ingestion filters, thus enabling ingestion of metrics with unknown identities.
Some probes are created automatically. These probes will not be deleted automatically. This keeps things simple operationally and implementation-wise.
Processors
The input processors of a probe handle the required configuration to ingest raw telemetry
into the probe to kickstart the data processing pipeline. For these processors, the number
of stage output items (one or many) is equal to the number of results in the specified graph
query(s). If multiple graph queries are specified, for example. graph_query: [A,
B]
, and query A matches 5 nodes and query B matches 10 nodes, results of query A
will be accessible using query_result
indices from 0 to 4, and results of
query B using indices from 5 to 14.
If a processor's input type and/or output type is not specified, then the processor takes a single input called in, and produces a single output called out.
Some processor fields are called expressions. In some cases, they are graph
queries and are so noted. In other cases, they are Python expressions that
yield a value. For example, in the Accumulate processor, duration may be specified as
integer with seconds, for example 900
, or as an expression, for example
60 * 15
. However, expressions could be more useful: there are multiple
ways to parameterize them.
Expressions support string values. Processor configuration parameters that are strings and
support expressions should use special quoting when specifying static value. For example,
state: "up"
is not valid because it refers to the variable "up", not a
static string, so it should be: state: '"up"'
.
An expression is always associated with a graph query and is run for every resulting match of that query. The execution context of the expression is such that every variable specified in the query resolves to a named node in the associated match result. For more information, see Service Collector example.
Graph-based processors have been extended with query_tag_filter, which enables you to filter graph query results by tags. In IBA probes, tags are used only as filter criteria for servers and external routers, specifically for the ECMP Imbalance (External Interfaces) probe and the Total East/West Traffic probe. For specific processor information, see Probe Processors in the References section.
Ingestion Filters
With "ingestion filters" one query result can ingest multiple metrics into a probe. Table
data types are used to store multiple metrics as part of a single stage output item. Table
data types include table_ns
, table_dss
,
table_ts
- to correspond to existing types - ns
,
dss
, ts
-respectively.
IBA Collection Filter
Collection filters determine the metrics that are collected from the target devices.
A collection filter for a given collector on a given device, is simply a collection of ingestion filters present in different probes. You can also specify it as part of enabling a service outside the context of IBA or probes but existing precedence rules for service enablement apply here - only filters at a given precedence level are aggregated. When multiple probes specify an ingestion filter targeting a specific service on a specific device, the metrics collected are a union - in other words, a metric is published when it matches any of the filters. This is why, the data is also filtered by the controller component prior to ingesting into the IBA probes.
This filter is evaluated by telemetry collectors, often to better control even what subset of available metrics is fetched from the underlying device operating system (for example, to fetch only a subset of routes instead of getting all routes, which can be a huge number). In any case, only the metrics matching the collection filter are published as the raw telemetry.
As part of enabling a service on a device, you can now specify collection filters for services. This filter becomes an additional input provided to collectors as part of "self.service_config.collection_filters".
IBA Filter Format
Following are the design/usability goals for filters (ingestion and collection)
- Ease of authoring - given probe authors are the ones specifying it
- Most often cases are match any, match against a given list of possible values, equality match, range check if key has numeric values.
- Efficient evaluation - given the filters are evaluated in the hot paths of collection or ingestion.
- Aggregatable - multiple filters are aggregated so this aggregation logic need not become the responsibility of individual collectors.
- Programming language neutral - components operating on filters can be in Python or C++ or some other language in future.
- Programmable - be amenable to future programmability around the filters, by the controller itself and/or collectors, to enhance things like usability, performance and so on.
Considering the above goals, following is a suggested and illustrative schema for filter1. Refer to ingestion filter sections for specific examples to understand this better.
FILTER_SCHEMA = s.Dict(s.Object( 'type': s.Enum(['any', 'equals', 'list', 'pattern', 'range', 'prefix']), 'value': s.OneOf({ 'equals': s.OneOf([s.String(), s.Integer()]), 'list': s.List(s.String(), validate=s.Length(min=1)), 'pattern': s.List(s.String(), validate=s.Length(min=1)), 'range': s.AnomalyRange(), validate=s.Length(min=1), 'prefix': s.Object({ 'prefixsubnet': s.Ipv6orIpv4NetworkAddress(), 'ge_mask': s.Optional(s.Integer()), 'le_mask': s.Optional(s.Integer()), 'eq_mask': s.Optional(s.Integer()) }) ), key_type=s.String(description= 'Name of the key in metric identity. Missing metric identity keys are ' 'assumed to match any value'))
One instance of filter specification is interpreted as AND of all specified keys (aka per-key constraints). Multiple filter specifications coming from multiple probes are considered as OR at the filter level.
The schema presented here is only for communicating the requirements. You can choose any way that accomplishes stated use cases.
Collector Processors additional_properties specified in collector processors' configuration
can be accessed using the special context.
namespace. For example, if a
collector defines property system_role
, it could be used this way:
duration: 60 * (15 if context.system_role == "leaf" else 10)
Items context is available as long as the items set is unchanged from the original set derived from the collector processor configuration. After data goes through a processor that changes this set, it's no longer available (for example, any grouping processor).
From the blueprint, navigate to Analytics > Probes to go to the probes table view. You can instantiate, create, clone, edit, delete, import, and export probes.
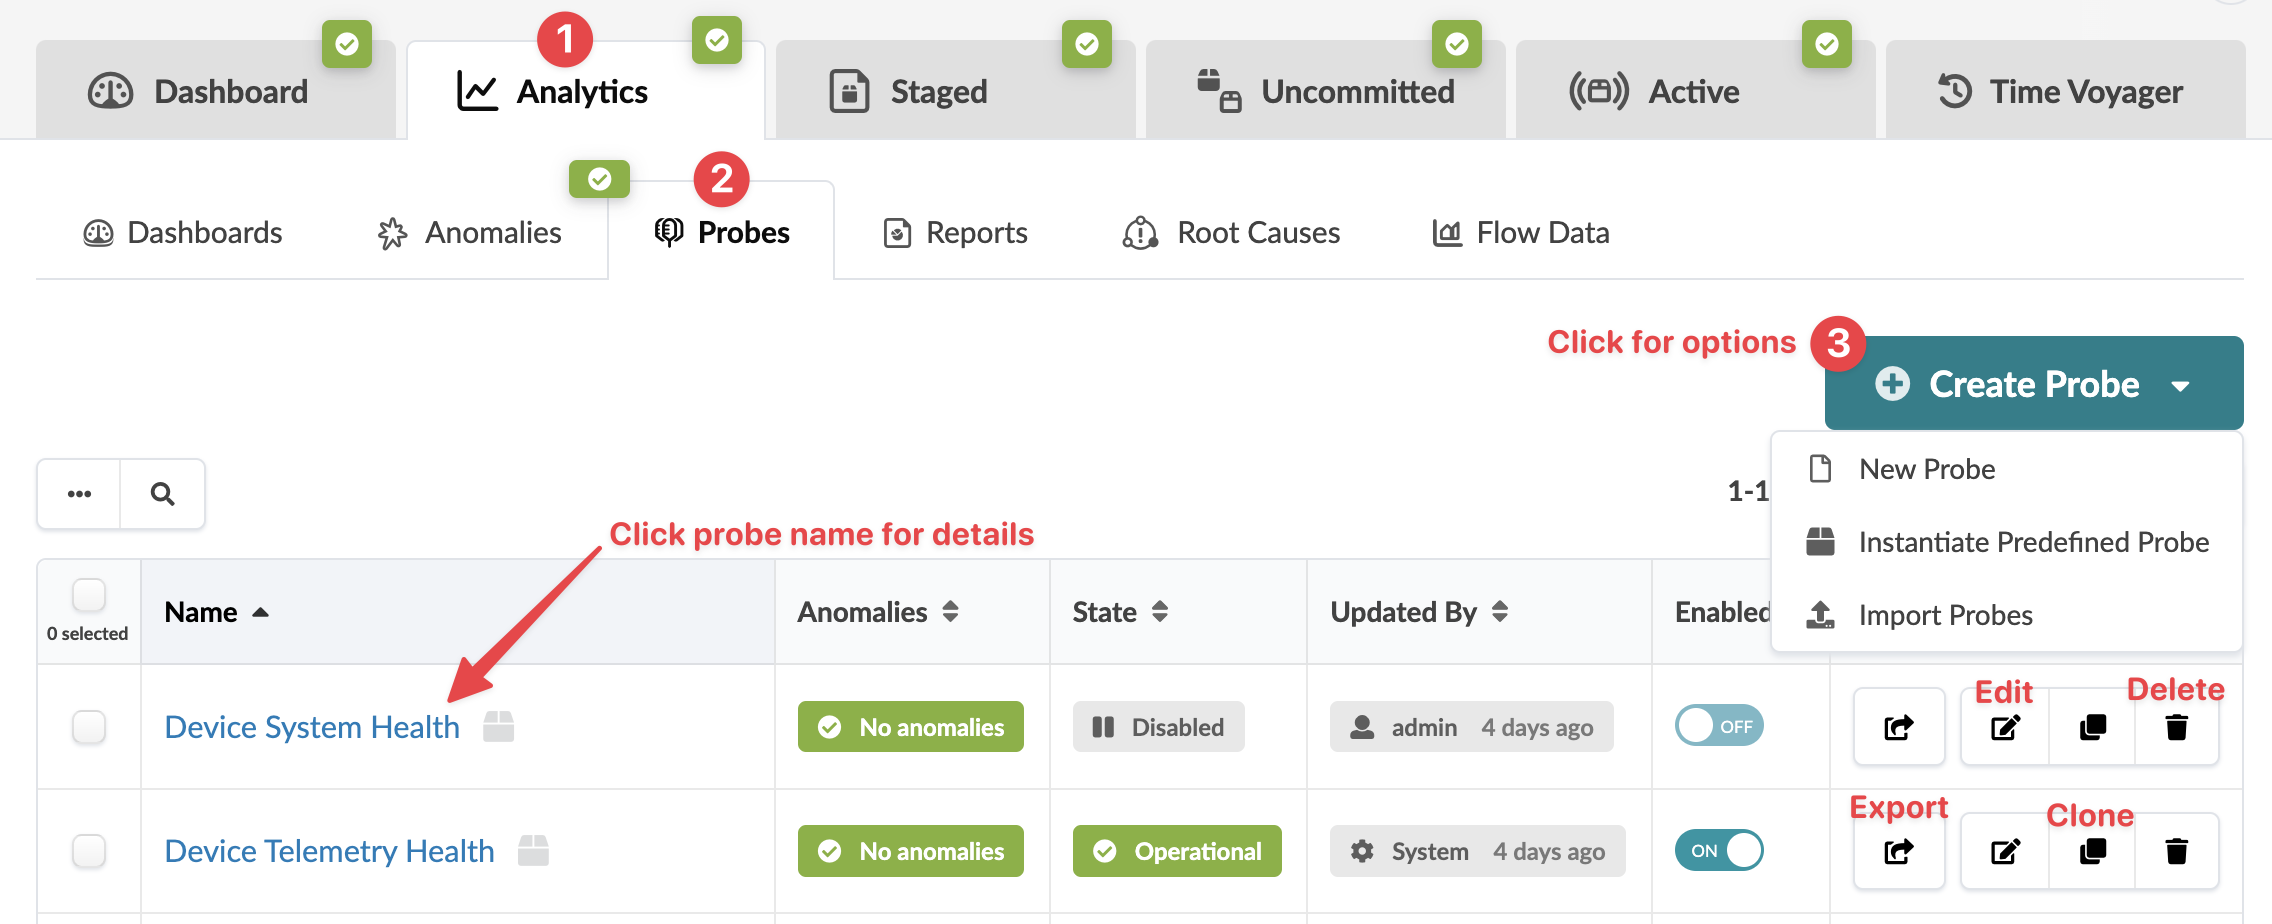
To go to a probe's details, click its name. You can enable/disable a probe from the table view or the detail view. You can display stages in some probes in various ways. For example, when you click the probe named Device System Health, you'll see the image below. You can select the data source (real time, time series, telemetry service warnings) then aggregate data in various ways. Also, you can see the disk space used on each probe, as applicable.
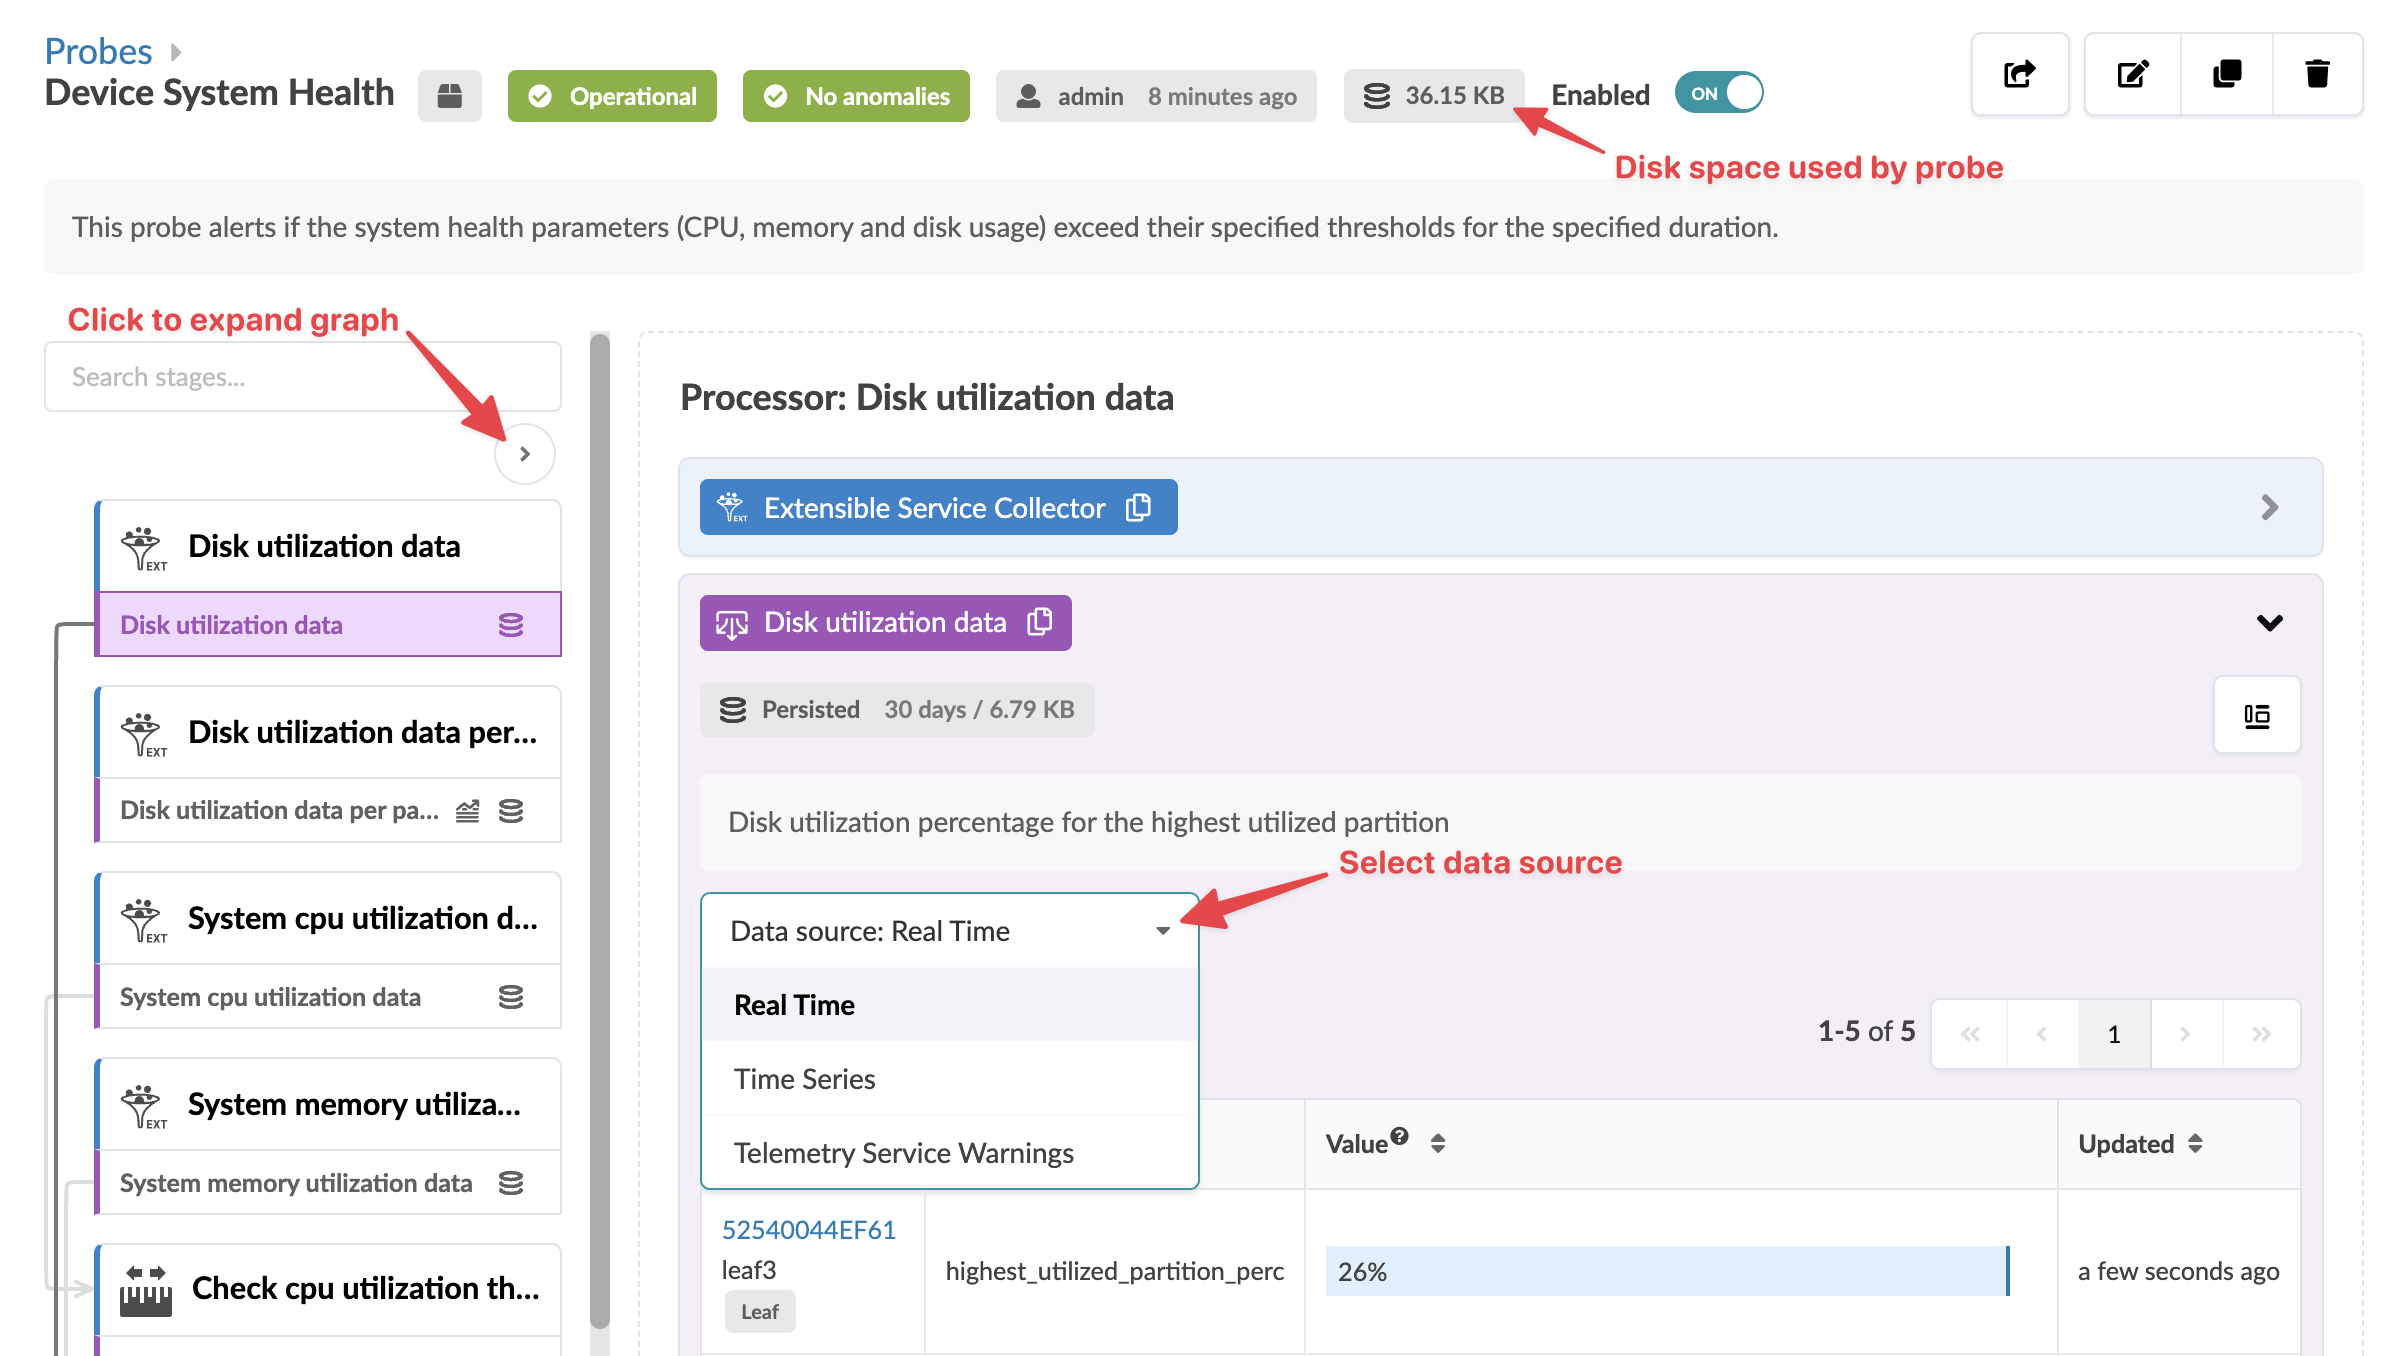
If the Apstra controller has insufficient disk space, older telemetry data files are deleted. To retain older telemetry data, you can increase capacity with Apstra VM Clusters.
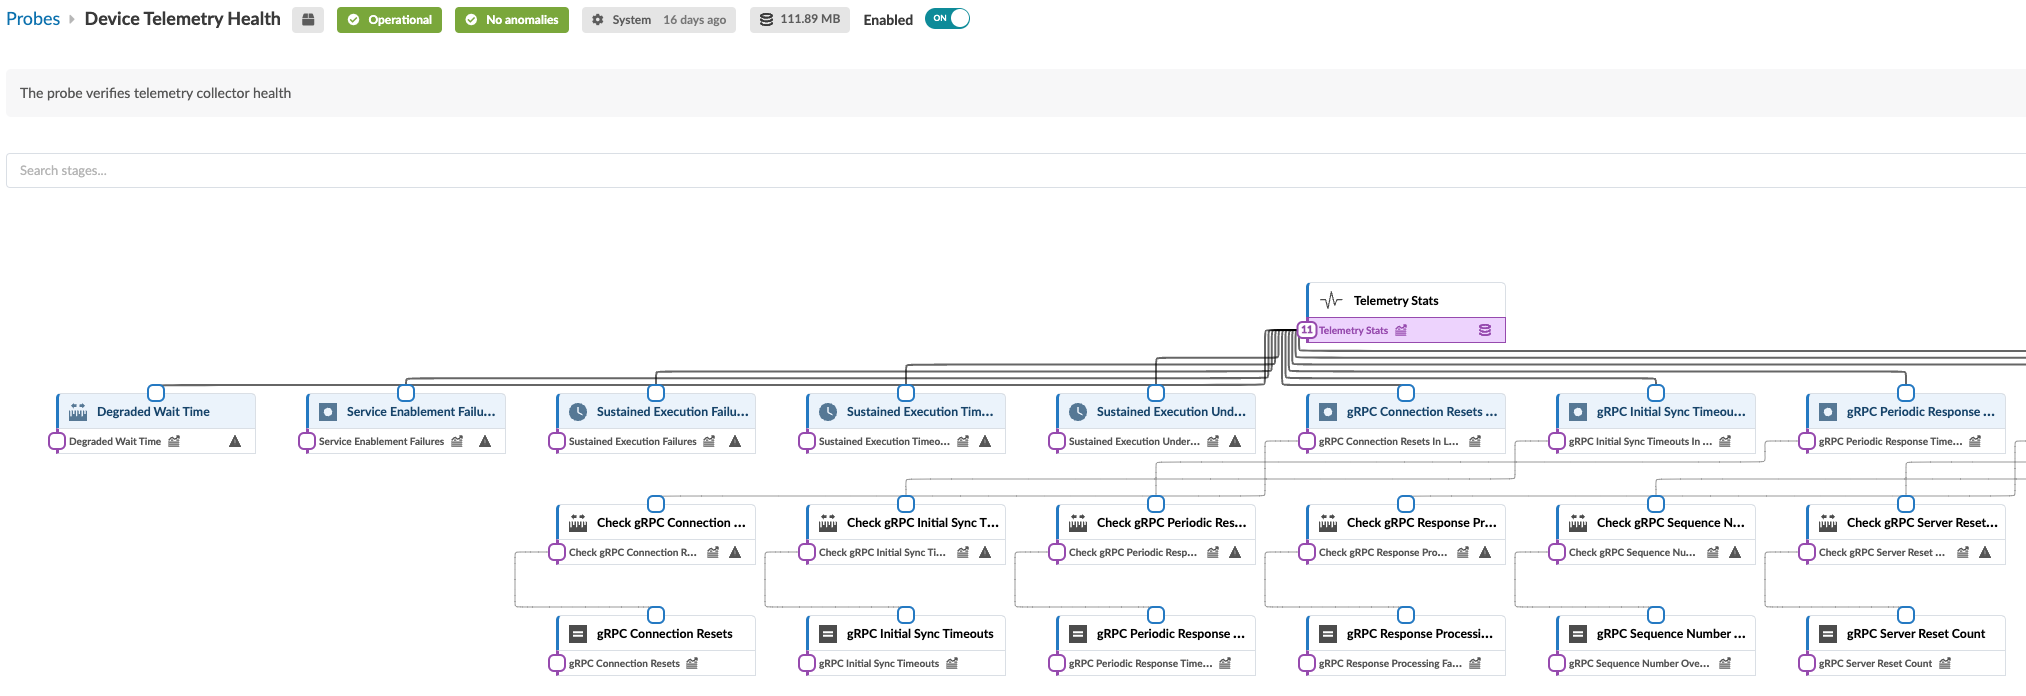
The structure and logic of non-linear probes with tens of processors is not easily distinguished in the standard view. You can click the expand button (top of left panel) to see an expanded representation of how the processors are inter-related. For example, the image below shows part of the expanded view of the Device Telemetry Health probe.