


- play_arrow Getting Started
- play_arrow Blueprints
- play_arrow Blueprint Analytics
- What are Blueprint Analytics
- play_arrow Dashboards
- What are Blueprint Analytics Dashboards
- Configure Auto-Enabled Blueprint Analytics Dashboards
- Instantiate Predefined Blueprint Analytics Dashboard
- Create Blueprint Analytics Dashboard
- Export Blueprint Analytics Dashboard
- Import Blueprint Analytics Dashboard
- Update Blueprint Analytics Dashboard
- Delete Blueprint Analytics Dashboard
- play_arrow Anomalies
- play_arrow Probes
- play_arrow Predefined Reports
- play_arrow Root Causes
- play_arrow Staged Freeform Blueprints
- Freeform Introduction
- play_arrow Blueprints
- play_arrow Physical
- play_arrow Selection
- play_arrow Topology
- play_arrow Systems
- Systems Introduction (Freeform)
- Create Internal System (Freeform)
- Create External System (Freeform)
- Update Assigned Config Template(Freeform)
- Update System Name (Freeform)
- Update Hostname (Freeform)
- Change Assigned Device Profile (Freeform)
- Update System ID Assignment (Freeform)
- Update Deploy Mode (Freeform)
- Add / Remove Tags on System (Freeform)
- Delete System (Freeform)
- Device Context (Freeform)
- play_arrow Links
-
- play_arrow Resource Management
- Resource Management Introduction (Freeform)
- play_arrow Blueprint Resources
- play_arrow Allocation Groups
- play_arrow Local Pools
- play_arrow Catalog (Freeform)
- play_arrow Config Templates
- play_arrow Device Profiles
- play_arrow Property Sets
- play_arrow Tags
-
- play_arrow Tasks
- play_arrow Uncommitted Blueprints
- play_arrow Active Datacenter Blueprints
- play_arrow Time Voyager (Blueprints)
- play_arrow Devices
- Device Configuration Lifecycle
- What are Managed Devices
- Add Managed Device
- Drain Device Traffic
- Upgrade Device NOS
- Device AAA
- play_arrow Device
- play_arrow Agent
- play_arrow Pristine Config
- play_arrow Telemetry
- play_arrow Apstra ZTP
- What is Apstra ZTP
- Create User Profile for Communicating with ZTP Server
- Download and Deploy Apstra ZTP Server VM
- Configure Static Management IP Address for Apstra ZTP Server
- Replace SSL Certificate for Apstra ZTP Server GUI
- Create Vendor-specific Custom Configuration
- Configure Credentials for Apstra ZTP Server GUI
- Configure Apstra Server Connection Details
- Configure DHCP Server for Apstra ZTP
- ztp.json Keys
- Configure ztp.json with Configurator
- Configure ztp.json with CLI
- Show Apstra ZTP Logs
- Onboard Devices with Apstra ZTP
- Check ZTP Status of Devices and Services
- Reset Apstra ZTP GUI Admin Password
- Authenticate User (AZTP REST API)
- play_arrow Device Profiles
- play_arrow Design
- play_arrow Logical Devices
- play_arrow Interface Maps
- play_arrow Rack Types
- play_arrow Templates
- play_arrow Config Templates (Freeform)
- play_arrow Configlets (Datacenter)
- play_arrow Property Sets (Datacenter)
- play_arrow TCP/UDP Ports
- play_arrow Tags
-
- play_arrow Resources
- play_arrow Analytics - Telemetry
- play_arrow Analytics - Flow
- play_arrow Apstra Flow Overview
- play_arrow Dashboards
- play_arrow Supported Flow Records
- play_arrow Flow Enrichment
- play_arrow Monitor Apstra Flow
- play_arrow Configuration Reference
- play_arrow API
- play_arrow Additional Documentation
- play_arrow Knowledge Base
-
- play_arrow Analytics - Exploratory Analytics
- play_arrow External Systems (RBAC Providers)
- play_arrow Providers
- play_arrow Provider Role Mapping
-
- play_arrow Platform
- play_arrow User Management
- play_arrow Security
- play_arrow External Services
- play_arrow Streaming
- Event Log (Audit Log)
- Licenses
- play_arrow Apstra VM Clusters
- play_arrow Developers
- play_arrow Technical Support
- Check Apstra Versions and Patent Numbers
-
- play_arrow Favorites & User
- play_arrow Apstra Server Management
- Apstra Server Introduction
- Monitor Apstra Server via CLI
- Restart Apstra Server
- Reset Apstra Server VM Password
- Reinstall Apstra Server
- Apstra Database Overview
- Back up Apstra Database
- Restore Apstra Database
- Reset Apstra Database
- Migrate Apstra Database
- Replace SSL Certificate on Apstra Server with Signed One
- Replace SSL Certificate on Apstra Server with Self-Signed One
- Change Apstra Server Hostname
- FIPS 140-2 Support
- play_arrow Apstra CLI Utility
- play_arrow Guides
- play_arrow References
- play_arrow Feature Matrix
- play_arrow Devices
- play_arrow Blueprint Analytics
- play_arrow Predefined Dashboards
- play_arrow Predefined Probes
- BGP Monitoring Probe
- Probe: Bandwidth Utilization
- Probe: Critical Services: Utilization, Trending, Alerting
- Probe: Device Environmental Checks
- Probe: Device System Health
- Probe: Device Telemetry Health
- Probe: Device Traffic
- Probe: Drain Traffic Anomaly
- Probe: ECMP Imbalance (External Interfaces)
- Probe: ECMP Imbalance (Fabric Interfaces)
- Probe: ECMP Imbalance (Spine to Superspine Interfaces)
- Probe: ESI Imbalance
- Probe: EVPN Host Flapping
- Probe: EVPN VXLAN Type-3 Route Validation
- Probe: EVPN VXLAN Type-5 Route Validation
- Probe: External Routes
- Probe: Hot/Cold Interface Counters (Fabric Interfaces)
- Probe: Hot/Cold Interface Counters (Specific Interfaces)
- Probe: Hot/Cold Interface Counters (Spine to Superspine Interfaces)
- Probe: Hypervisor and Fabric LAG Config Mismatch Probe (Virtual Infra)
- Hypervisor and Fabric VLAN Config Mismatch Probe
- Probe: Hypervisor MTU Mismatch Probe (Virtual Infra - NSX-T Only)
- Probe: Hypervisor MTU Threshold Check Probe (Virtual Infra)
- Probe: Hypervisor Missing LLDP Config Probe (Virtual Infra)
- Probe: Hypervisor Redundancy Checks Probe (Virtual Infra)
- Probe: Interface Flapping (Fabric Interfaces)
- Probe: Interface Flapping (Specific Interfaces)
- Probe: Interface Flapping (Specific Interfaces)
- Probe: Interface Policy 802.1x
- Probe: LAG Imbalance
- Probe: Leafs Hosting Critical Services: Utilization, Trending, Alerting
- Probe: Link Fault Tolerance in Leaf and Access LAGs
- Probe: MAC Monitor
- Probe: MLAG Imbalance
- Probe: Multiagent Detector
- Probe: Optical Transceivers
- Probe: Packet Discard Percentage
- Probe: Spine Fault Tolerance
- Probe: Total East/West Traffic
- Probe: VMs without Fabric Configured VLANs Probe (Virtual Infra)
- Probe: VXLAN Flood List Validation
- play_arrow Probe Processors
- Processor: Accumulate
- Processor: Average
- Processor: BGP Session
- Processor: Comparison
- Processor: Environment
- Processor: EVPN Type 3
- Processor: EVPN Type 5
- Processor: Extensible Service Collector
- Processor: Generic Graph Collector
- Processor: Generic Service Data Collector
- Processor: Interface Counters
- Processor: Logical Operator
- Processor: MAC
- Processor: Match Count
- Processor: Match Percentage
- Processor: Match String
- Processor: Max
- Processor: Min
- Processor: Optical Threshold
- Processor: Optical Xcvr
- Processor: Periodic Average
- Processor: Periodic Change
- Processor: Range
- Processor: Ratio
- Processor: Service Collector
- Processor: Set Comparison
- Processor: Set Count
- Processor: Standard Deviation
- Processor: State
- Processor: Subtract
- Processor: Sum
- Processor: System Utilization
- Processor: Telemetry Service Health
- Processor: Time in State
- Processor: Traffic Monitor
- Processor: Union
- Processor: VXLAN Floodlist
- Configlet Examples (Design)
- Apstra EVPN Support Addendum
- Apstra Server Configuration File
- Graph
- Juniper Apstra Tech Previews
-
vCenter Virtual Infra
VMware vSphere Integration Overview
With Apstra vCenter integration, you have VM visibility of your virtualized environments. This feature helps to troubleshoot various VM connectivity issues. Inconsistencies between virtual network settings (VMware Port Groups) and physical networks (Apstra Virtual Networks) that might affect VM connectivity are flagged.
To accomplish this, the Apstra software identifies the ESX/ESXi hosts and thereby the VMs connected to Apstra-managed leaf switches. LLDP information transmitted by the ESX/ESXi hosts is used to associate host interfaces with leaf interfaces. For this feature to work, LLDP transmit must be enabled on the VMware distributed virtual switch.
The Apstra software also connects to vCenter to collect information about VMs, ESX/ESXi hosts, port groups and VDS. Apstra extensible telemetry collectors collect this information. The collector runs in an offbox agent and uses pyVmomi to connect to vCenter. On first connect, it downloads all of the necessary information and thereafter polls vCenter every 60 seconds for new updates. The collector updates the discovered data into the Apstra Graph Datastore allowing VM queries and alerts to be raised on physical/virtual network mismatch.
Supported Versions
Apstra VMware integration is supported on the following VMware vCenter Server/vSphere versions: 8.0, 7.0U1, 6.7, 6.5.
The specific test and qualification for version 7.0 is three vCenter servers on three different routing zones: zone 1 supports 3000 VMs, zone 2 supports 1000 VMs, and zone 3 supports 1000 VMs. We support vCenter managed data center stretched clusters. vCenter segregation is based on workload, not location.
Limitations
vCenter integration does not support DVS port group with VLAN type Trunking.
Enable vCenter Integration
You only need Read permissions to enable vSphere Integration.
- From the left navigation menu, navigate to External Systems >
Virtual Infra Managers and click Create Virtual
Infra Manager.
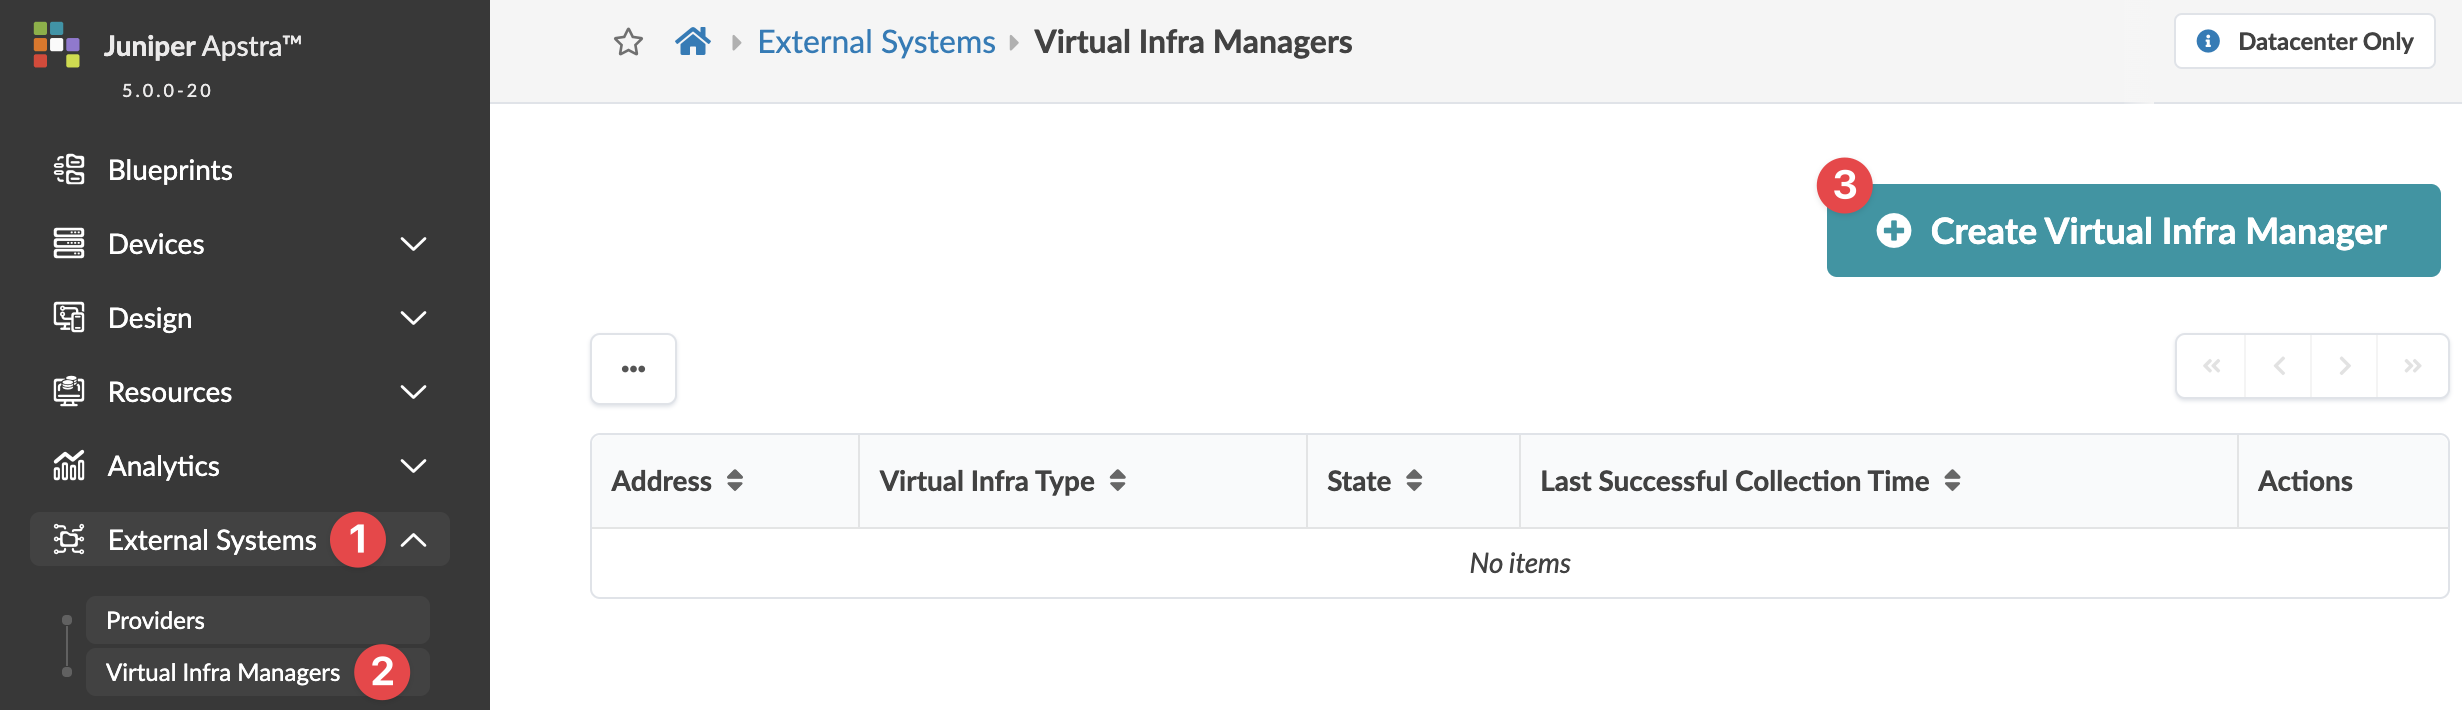 The Create Virtual Infra Manager dialog opens.
 - When vCenter is connected, from the blueprint, navigate to
Staged > Virtual > Virtual Infra and click
Add Virtual Infra.
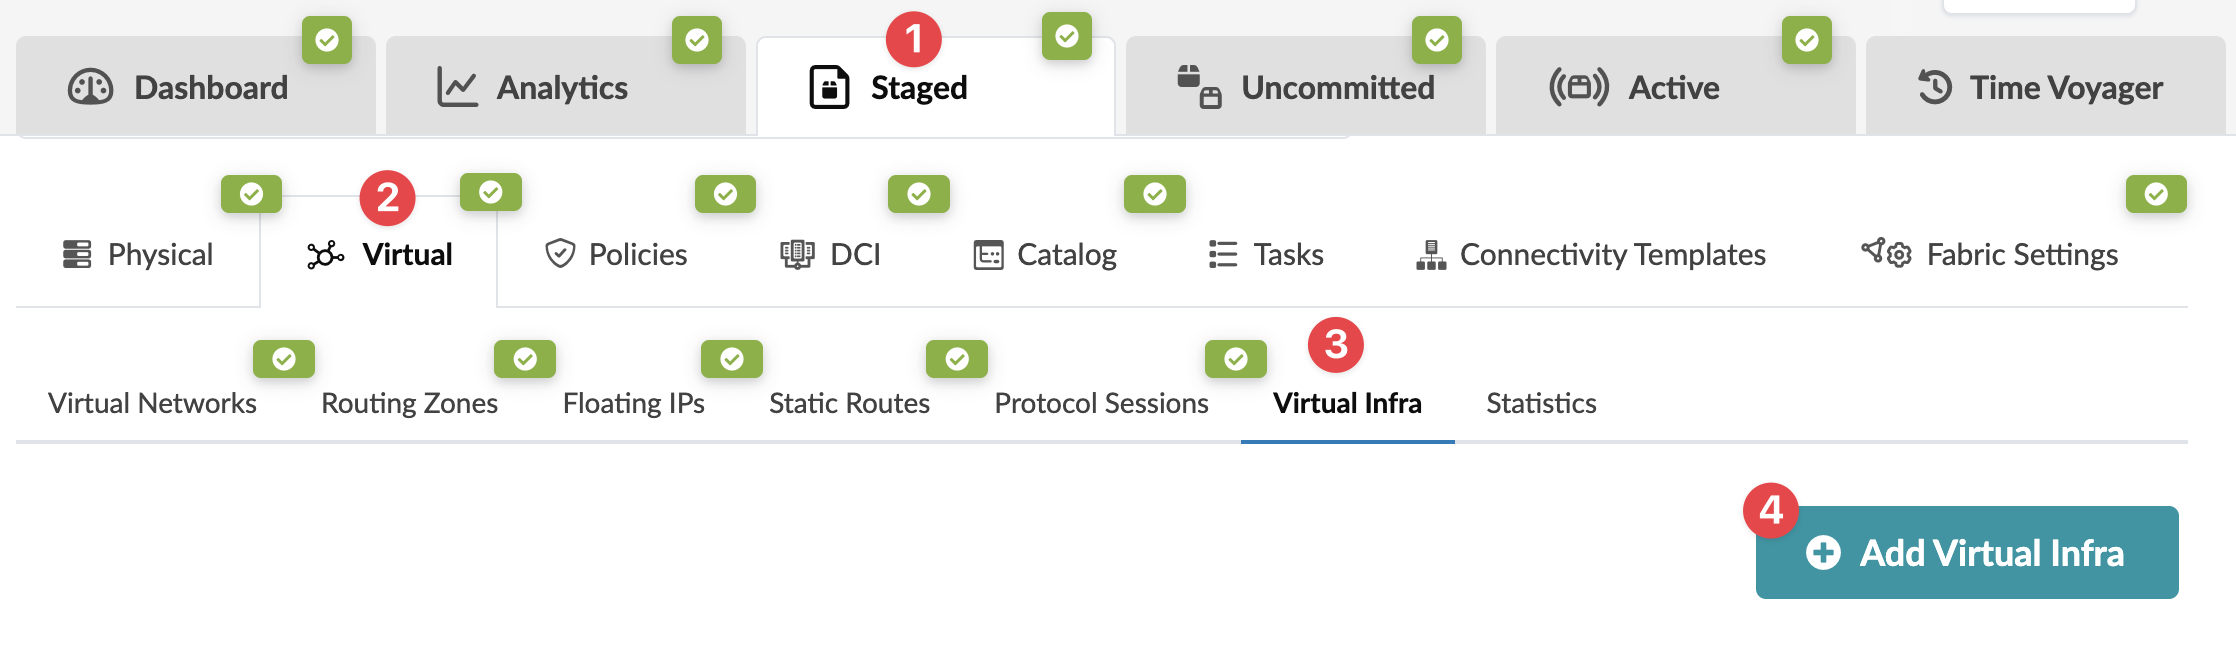 The Add Virtual Infra Manager dialog opens.
When you're ready to deploy, commit the changes from the Uncommitted tab.
VM Visibility
When Apstra software manages virtual infra, you can query VMs by name. From the blueprint, navigate to Active > Query > VMs and enter search criteria. VMs include the following details:
| Parameter | Description |
|---|---|
| Hosted On | The ESX host that the VM is on |
| VM IP | The IP address as reported by vCenter after installation of VM tools. If the IP address is not available this field is empty. If the IP address is available, the VM IP address is displayed. |
| Leaf:Interface | The leaf and the interface ESX host is connected to |
| Port Group Name:VLAN ID | The VNIC’s portgroup and the VLAN ID associated with the portgroup |
| MAC Addresses | MAC address of the VNIC |
| Virtual Infra Address | IP address of the vCenter the VM is part of |
Validate Virtual Infra Integration
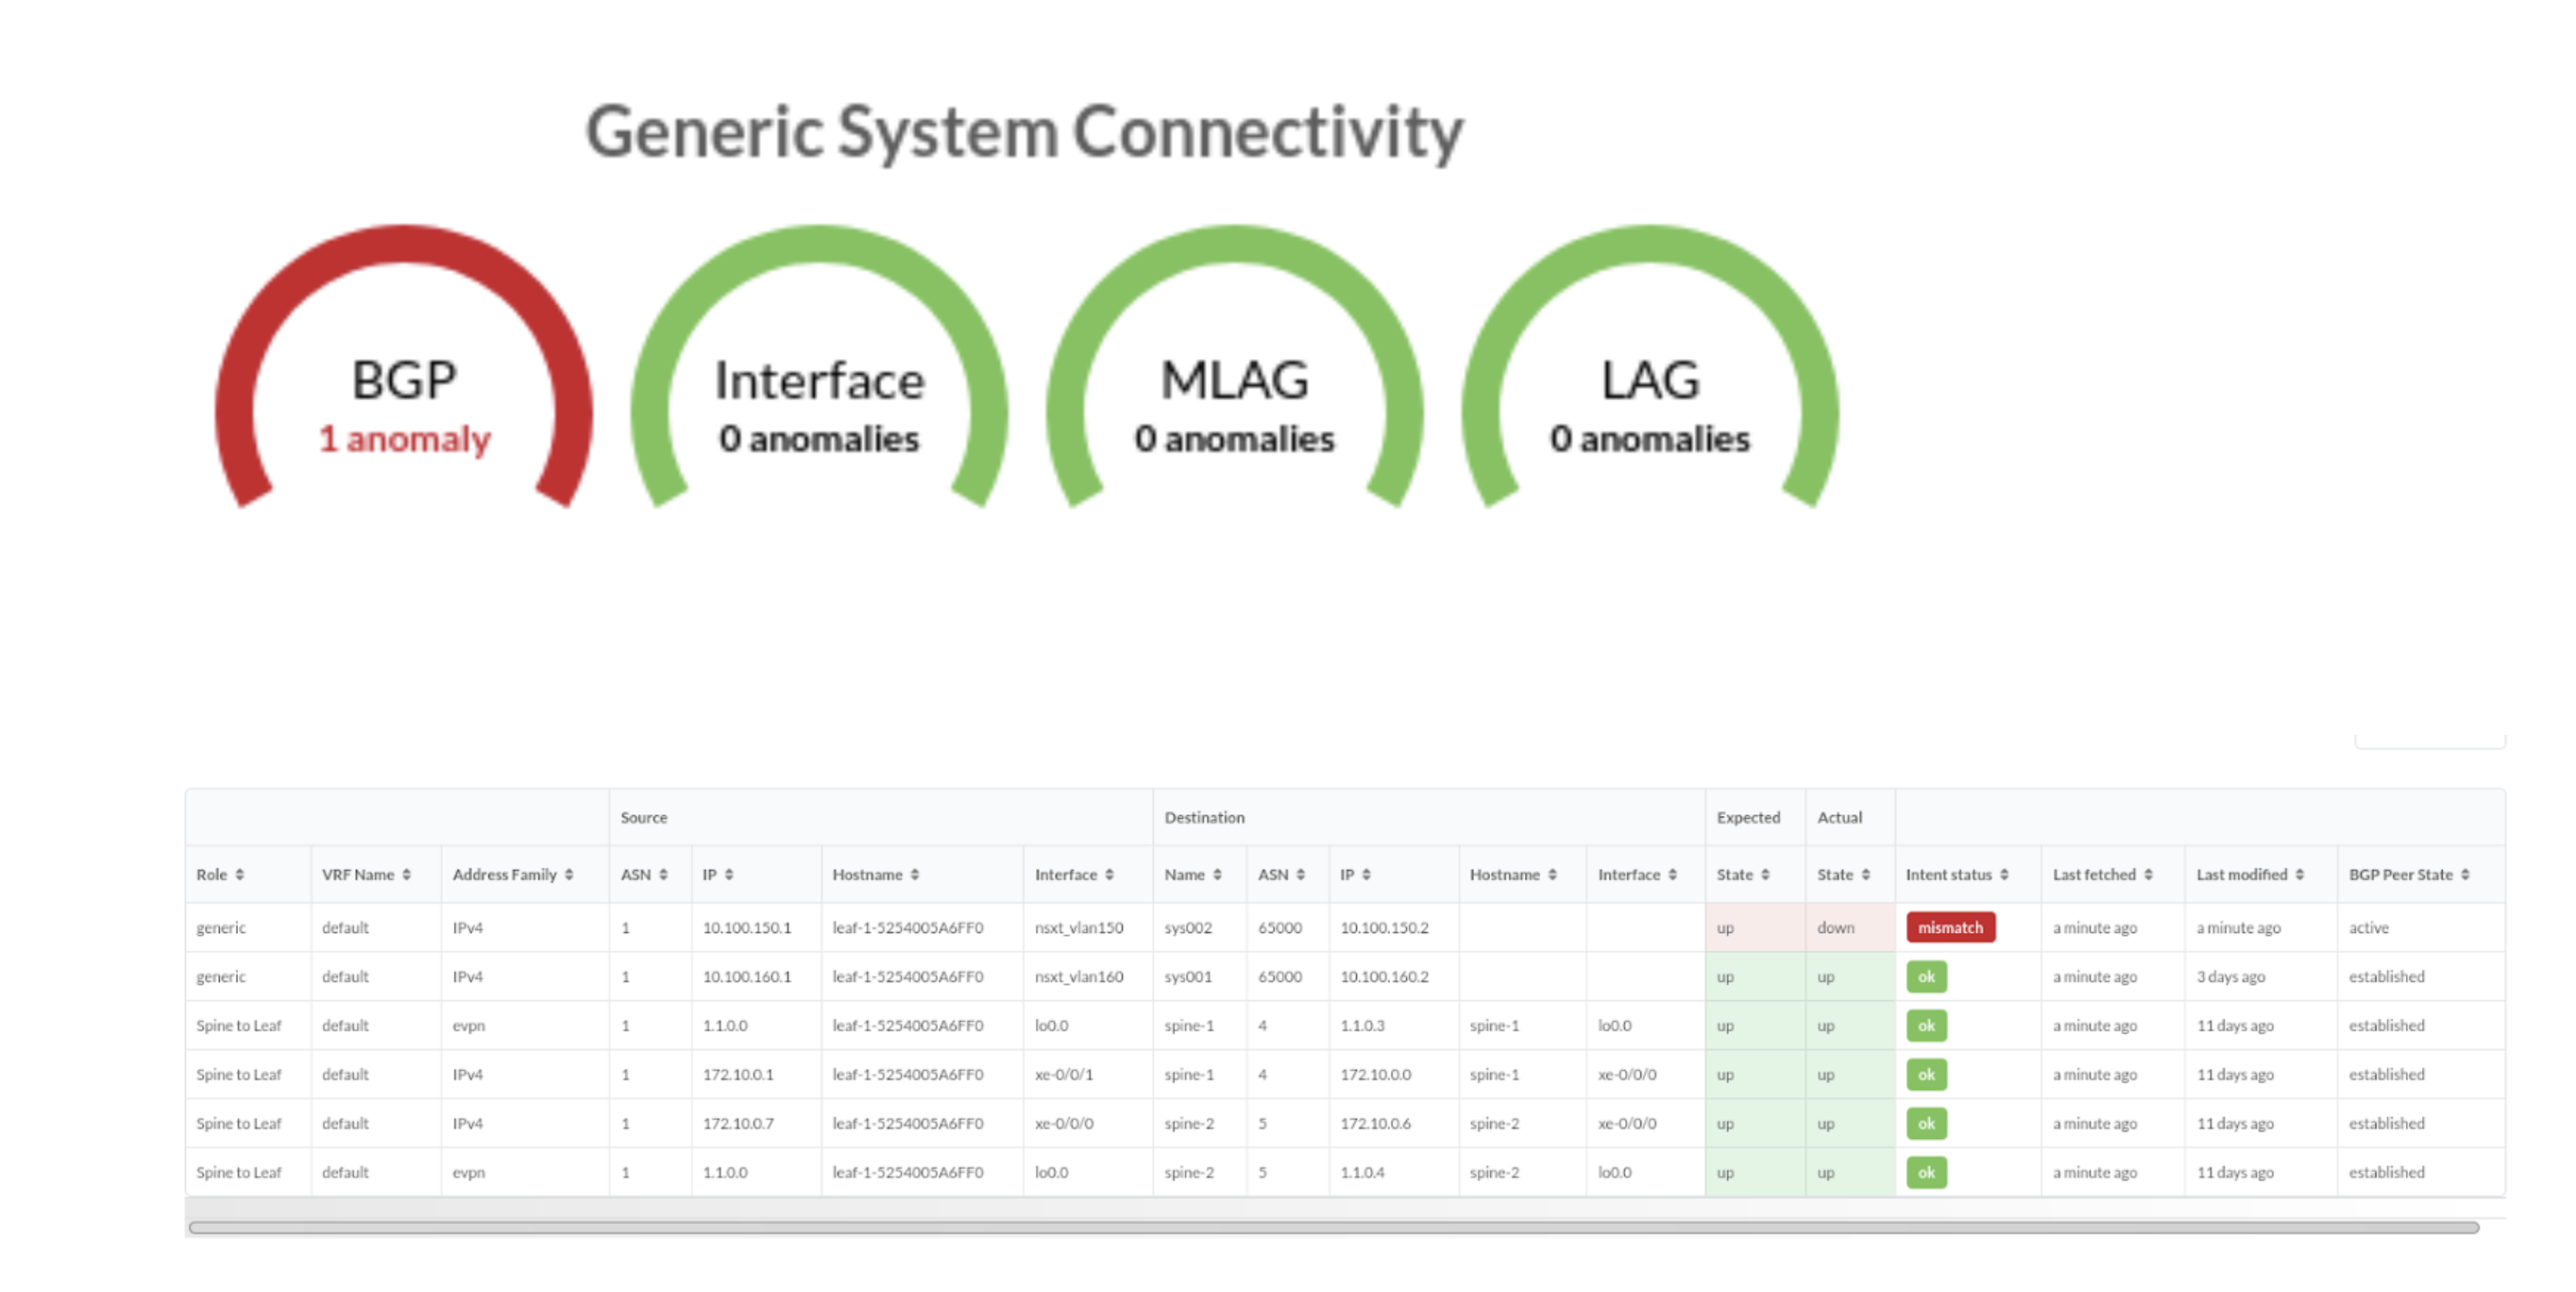
You can validate virtual infra with intent-based analytics. Apstra validates BGP
session towards NSX-T Edge. In case BGP neighborship in NSX-T Manager is deleted
then respective anomalies can be seen in Apstra dashboard.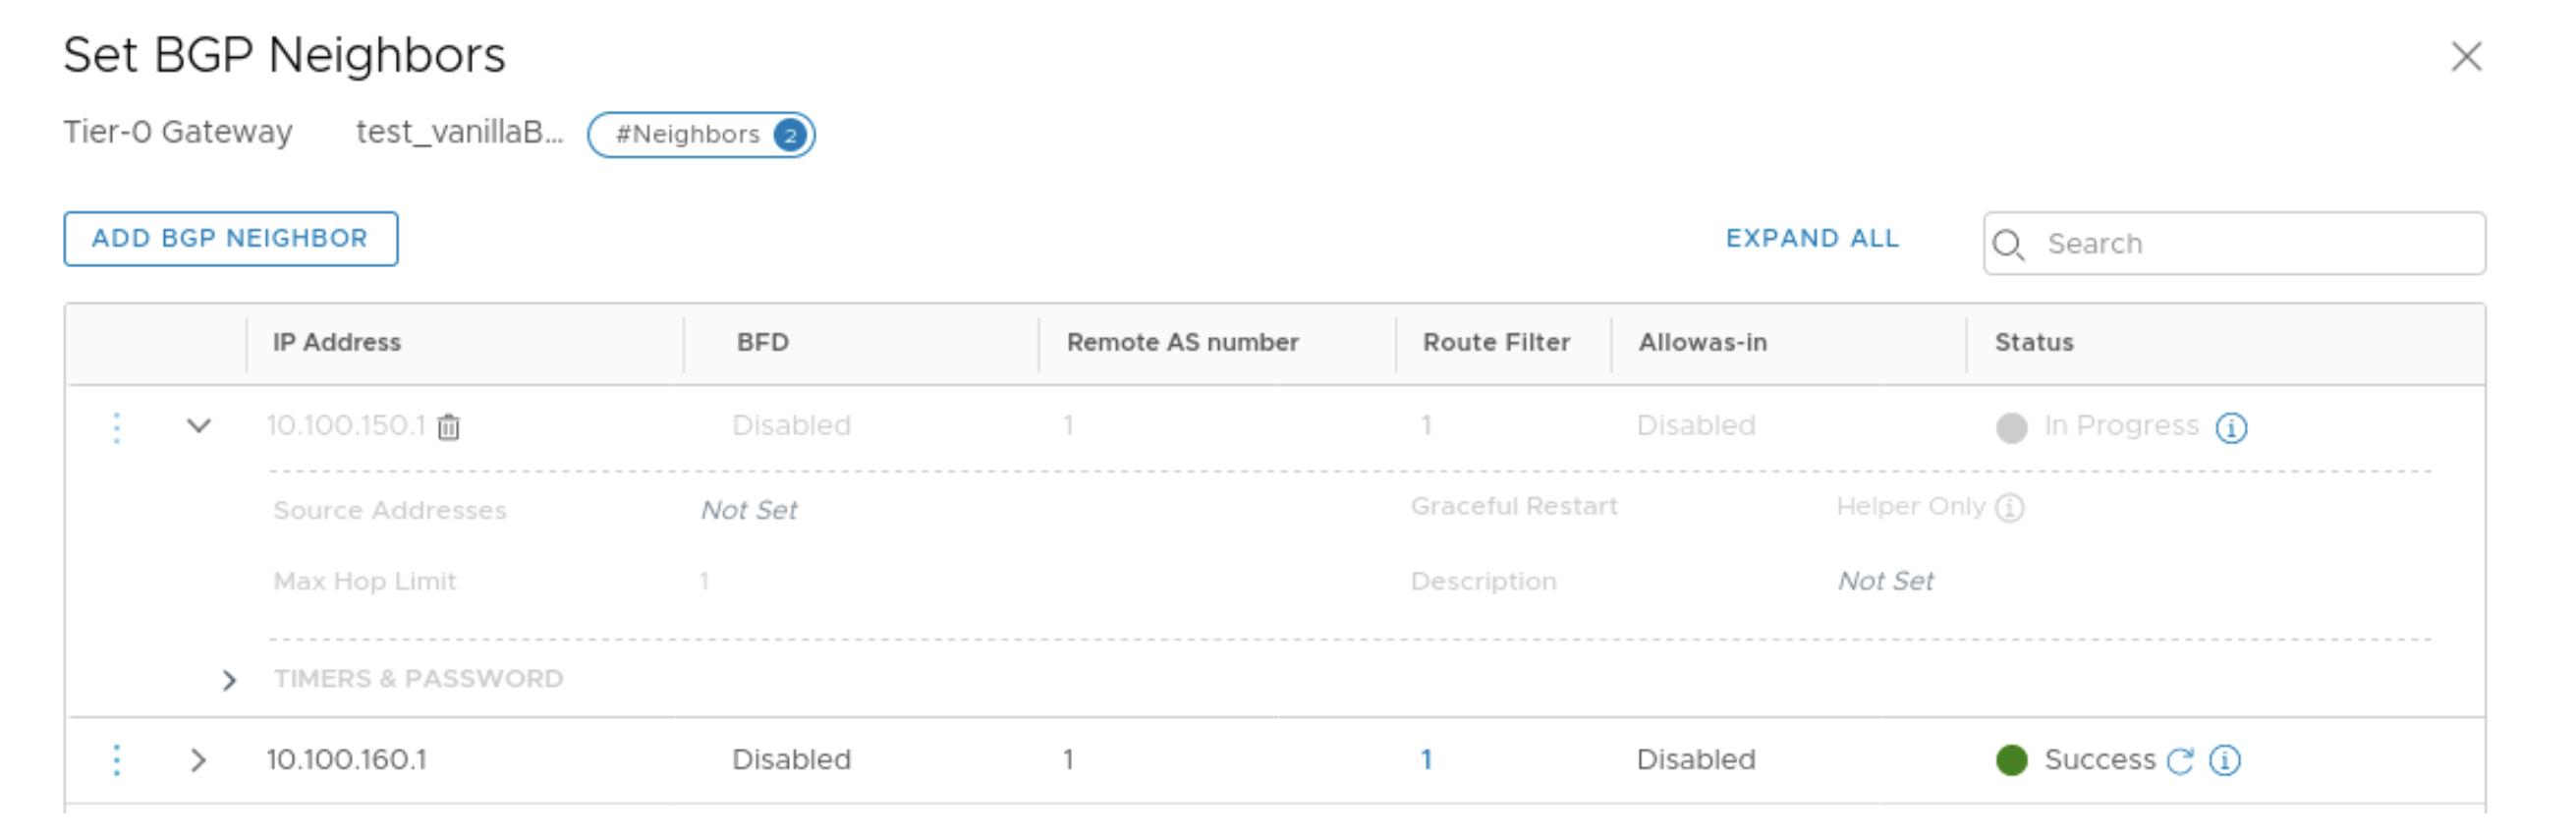
Two predefined analytics dashboards (as listed below) are available that instantiate predefined virtual infra probes.
Virtual Infra Fabric Health Check Dashboard
- Hypervisor MTU Mismatch Probe
- Hypervisor MTU Threshold Check Probe
- Hypervisor & Fabric LAG Config Mismatch Probe
- Hypervisor & Fabric VLAN Config Mismatch Probe
- Hypervisor Missing LLDP Config Probe
- VMs without Fabric Configured VLANs Probe
Virtual Infra Redundancy Check Dashboard
See Also
Auto-Remediation Overview
Automatic remediation of virtual network anomalies is available without user intervention. This can reduce operational cost when network operators don't need to investigate each anomaly and check for details and intervene to mitigate anomalies. VxLAN auto-remediation is a policy configured while adding vCenter/NSX-T to a blueprint. Anomaly remediation is done in accordance with this policy.
A policy-based auto-remediation approach automatically notifies you if there is a mismatch between vSphere DPG (VMware Port Groups) and VN in a particular blueprint, or if there is a VLAN mismatch between virtual infra and the Apstra fabric, or if there is a mismatch in LAG configuration on hypervisors and the corresponding leaf ports. Apstra software provides automatic guided remediation of such anomalies.
Some of the constraints and validations that take place before the remediation happens are listed below:
- When remediation policy is set to VLAN, that is rack-local, routing zone can only be the default one.
- If VLAN ID for virtual network spanning multiple hypervisors is the same, a single layer 2 broadcast domain is assumed. For such scenarios, the VLAN remediation policy must be set to VXLAN as for missing VLAN anomalies it is checked on all the ToR leaf devices connected to different hypervisors having virtual network with the same VLAN ID. If this is mistakenly chosen as VLAN type, validation errors are generated.
- Errors are flagged for different types of remediation policies (For example, if one is VXLAN type and other is VLAN type) are found attached to different virtual infras (such as two different vCenter servers) having the same VLAN ID in anomalies.
- If two different virtual infra servers are mapped in a blueprint and they have the same VLAN IDs then it is checked as two separate virtual networks by VXLAN auto-remediation policy.
Enable Auto-Remediation
After enabling the VLAN remediation policy as inter-rack, Apstra software searches for matching local VLANs in all ToRs connecting any member host (hypervisor for example) participating in the virtual infra virtual network. If such a VN is found, it simply extends that VN to also be bound to the ToR in question with the same local VLAN. If it's not found, a new inter-rack VN is created in the specified routing zone.
Remediate Probe Anomalies
The Remediate Anomalies feature works in conjunction with the Virtual Network (Single) primitive in connectivity templates. It can't be used with the Virtual Network (Multiple) primitive.
Apstra policy-based remediation has the following features:
- VLAN mismatch anomalies create one virtual network for one vCenter Distributed Virtual Switch (vDS) port group that is attached to hypervisors connected to leaf ports of ToRs in Apstra fabric.
- You cannot delete a routing zone that is being referenced in remediation policy.
For an EVPN-enabled fabric, we recommend that you have VN type as inter-rack or VXLAN in a specific routing zone.
- From the blueprint, navigate to Analytics > Probes and click one of the instantiated predefined probe names.
- Click Remediate Anomalies on a given stage. The Apstra software automatically updates the staged blueprint by adding/removing/updating VN endpoints and VNs to resolve the anomalies.
- Review the staged configuration in terms of virtual network parameters, then commit the configuration. The Apstra software indicates if there are no detected changes. This could happen if you invoke remediation more than once.
- Review and commit the changes on the Uncommitted tab.
- Return to the predefined probe to view any remaining anomalies.
Disable Virtual Infra Integration
Virtual infra integrations are disabled by deleting them from the blueprint and external systems.
- From the blueprint, navigate to Staged > Virtual > Virtual Infra and click the Delete button for the virtual infra to disable.
- Click Uncommitted (top menu) and commit the deletion.
- From the left navigation menu, navigate to External Systems > Virtual Ingra Managers and click the Delete button for the virtual infra to disable.
