Device Telemetry Services
Apstra ships with a set of built-in telemetry services that are automatically collected when a device is connected. You can also develop your own telemetry services.
View Device Telemetry
-
From the left navigation menu in the Apstra GUI, navigate to Devices >
Managed Devices and click the Management IP of the device to
view.
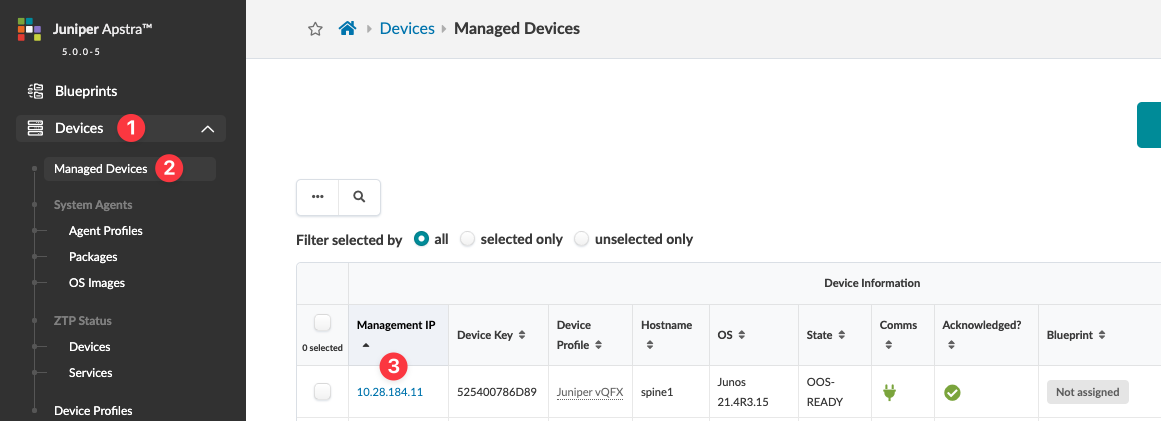 A page opens that includes information about the device, agent, pristine configuration, and telemetry.
 -
Click the Telemetry tab to open the
Telemetry details page.
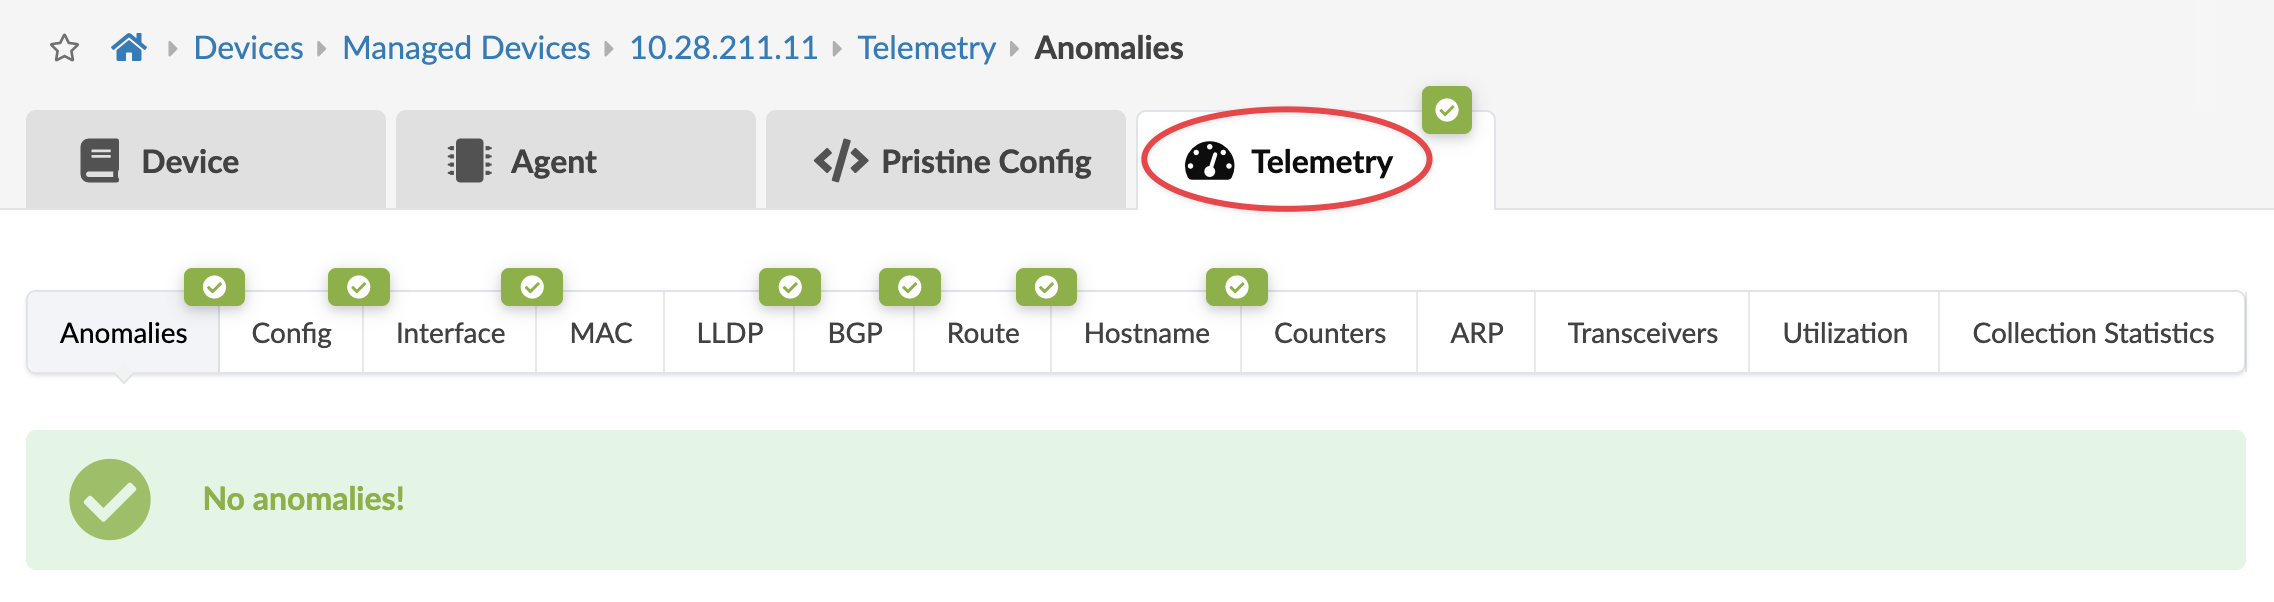 The Telemetry page includes tabs for any telemetry anomalies, the various telemetry services, and collection statistics.
Anomalies
If there are any anomalies (indicated in red) from these telemetry services they are aggregated under the Anomalies tab. You can look here to see an overview of all telemetry anomalies for the device (or under the individual service tabs for specific service anomalies).
Telemetry Services
| Service | Description |
|---|---|
| ARP | ARP telemetry shows an ARP table. You can query this information via API. Anomalies are not generated. |
| BGP | BGP telemetry shows role(s), VRF name, address family, source and destination information, expected and actual states, intent status, last fetched/modified, and BGP peer state. |
| Config |
This is the running config. Devices with deviations between the rendered discovered/service config and the actual config are flagged with a config deviation error. When configuration changes are made outside of Apstra management, alarms are generated immediately. The risk with a configuration deviation is that it is possible for Apstra to overwrite the deviated configuration with a configuration re-write. The correct way to deal with a config deviation alarm is to understand the configuration change being made, and consider setting it up as a configlet instead. |
| Counters | Counter telemetry provides information about interface in/out packets, interface errors, statistics, and so on. This feature is consumed by other advanced downstream features like telemetry streaming. No anomalies are generated. |
| Hostname | When you assign a device with deploy mode Ready to a blueprint, the device enters the Ready stage (previously known as Discovery 2). Hostname telemetry is collected that validates the device hostname against intent. Mismatches result in anomalies. |
| Interface | When you assign a device with deploy mode Ready to a blueprint, the device enters the Ready stage (previously known as Discovery 2). Interface telemetry is collected that compares intent with the up/down state of physical interfaces. It does not include LLDP, LAG or any other attachment information. |
| LAG | LAG telemetry shows the health of all the LACP bonds facing servers and between MLAG switches. |
| LLDP (Cabling) | When you assign a device with deploy mode Ready to a blueprint, the device enters the Ready stage (previously known as Discovery 2). Every node is part of intent. On each link, there are expected neighbor hostnames, interfaces and connections. Physical cabling and links must match the specified intent. Any deviations result in anomalies that you must correct by either recabling to match the blueprint or by modifying the blueprint to match cabling already in place. |
| MAC | MAC Address-table telemetry shows which MAC addresses appear on which interfaces, and which VLANs. |
| MLAG |
MLAG telemetry tracks the health status of the MLAG domain itself - the control-protocols required between two leaf switches communicating with each other properly for the MLAG domain state. Implementation detail differences exist between multiple vendors, but the intent is the same -the switches should be healthy among each other. MLAG telemetry is only available for L2 blueprints that have at least one virtual network assigned in an MLAG pair. If an MLAG-attached server is not fully connected, the state changes from ‘active_full’ to ‘active_partial’. Note:
Cisco MLAG (VPC) commands cannot derive the status of the LAG on the VPC peer switch. Accordingly, the state dual-active cannot actually gather the command. This is a limitation from Cisco. |
| Route | Routing telemetry analyzes the routing table on every managed spine and leaf. Since the entire IP fabric is managed, you can derive and predict full IP table information from the network topology. Deviations in the network routing telemetry (for example, a missing next-hop IP address for a default route) cause an alarm. |
| Transceivers | Transceiver telemetry gives the network operator statistics on optical interfaces, showing DOM statistics, light levels, lossy interfaces, and other optical statistics. No anomalies are generated. |
| Utilization (Onbox agents only) |
Utilization telemetry allows the network operator to view some vital statistics on the device - CPU and Memory utilization. No anomalies are generated. Utilization telemetry is not available on devices using offbox agents (Junos for example). Therefore, the utilization tab contains the error Network Device not found. |
| You can collect additional telemetry | See the Extensible Telemetry Guide for details. |
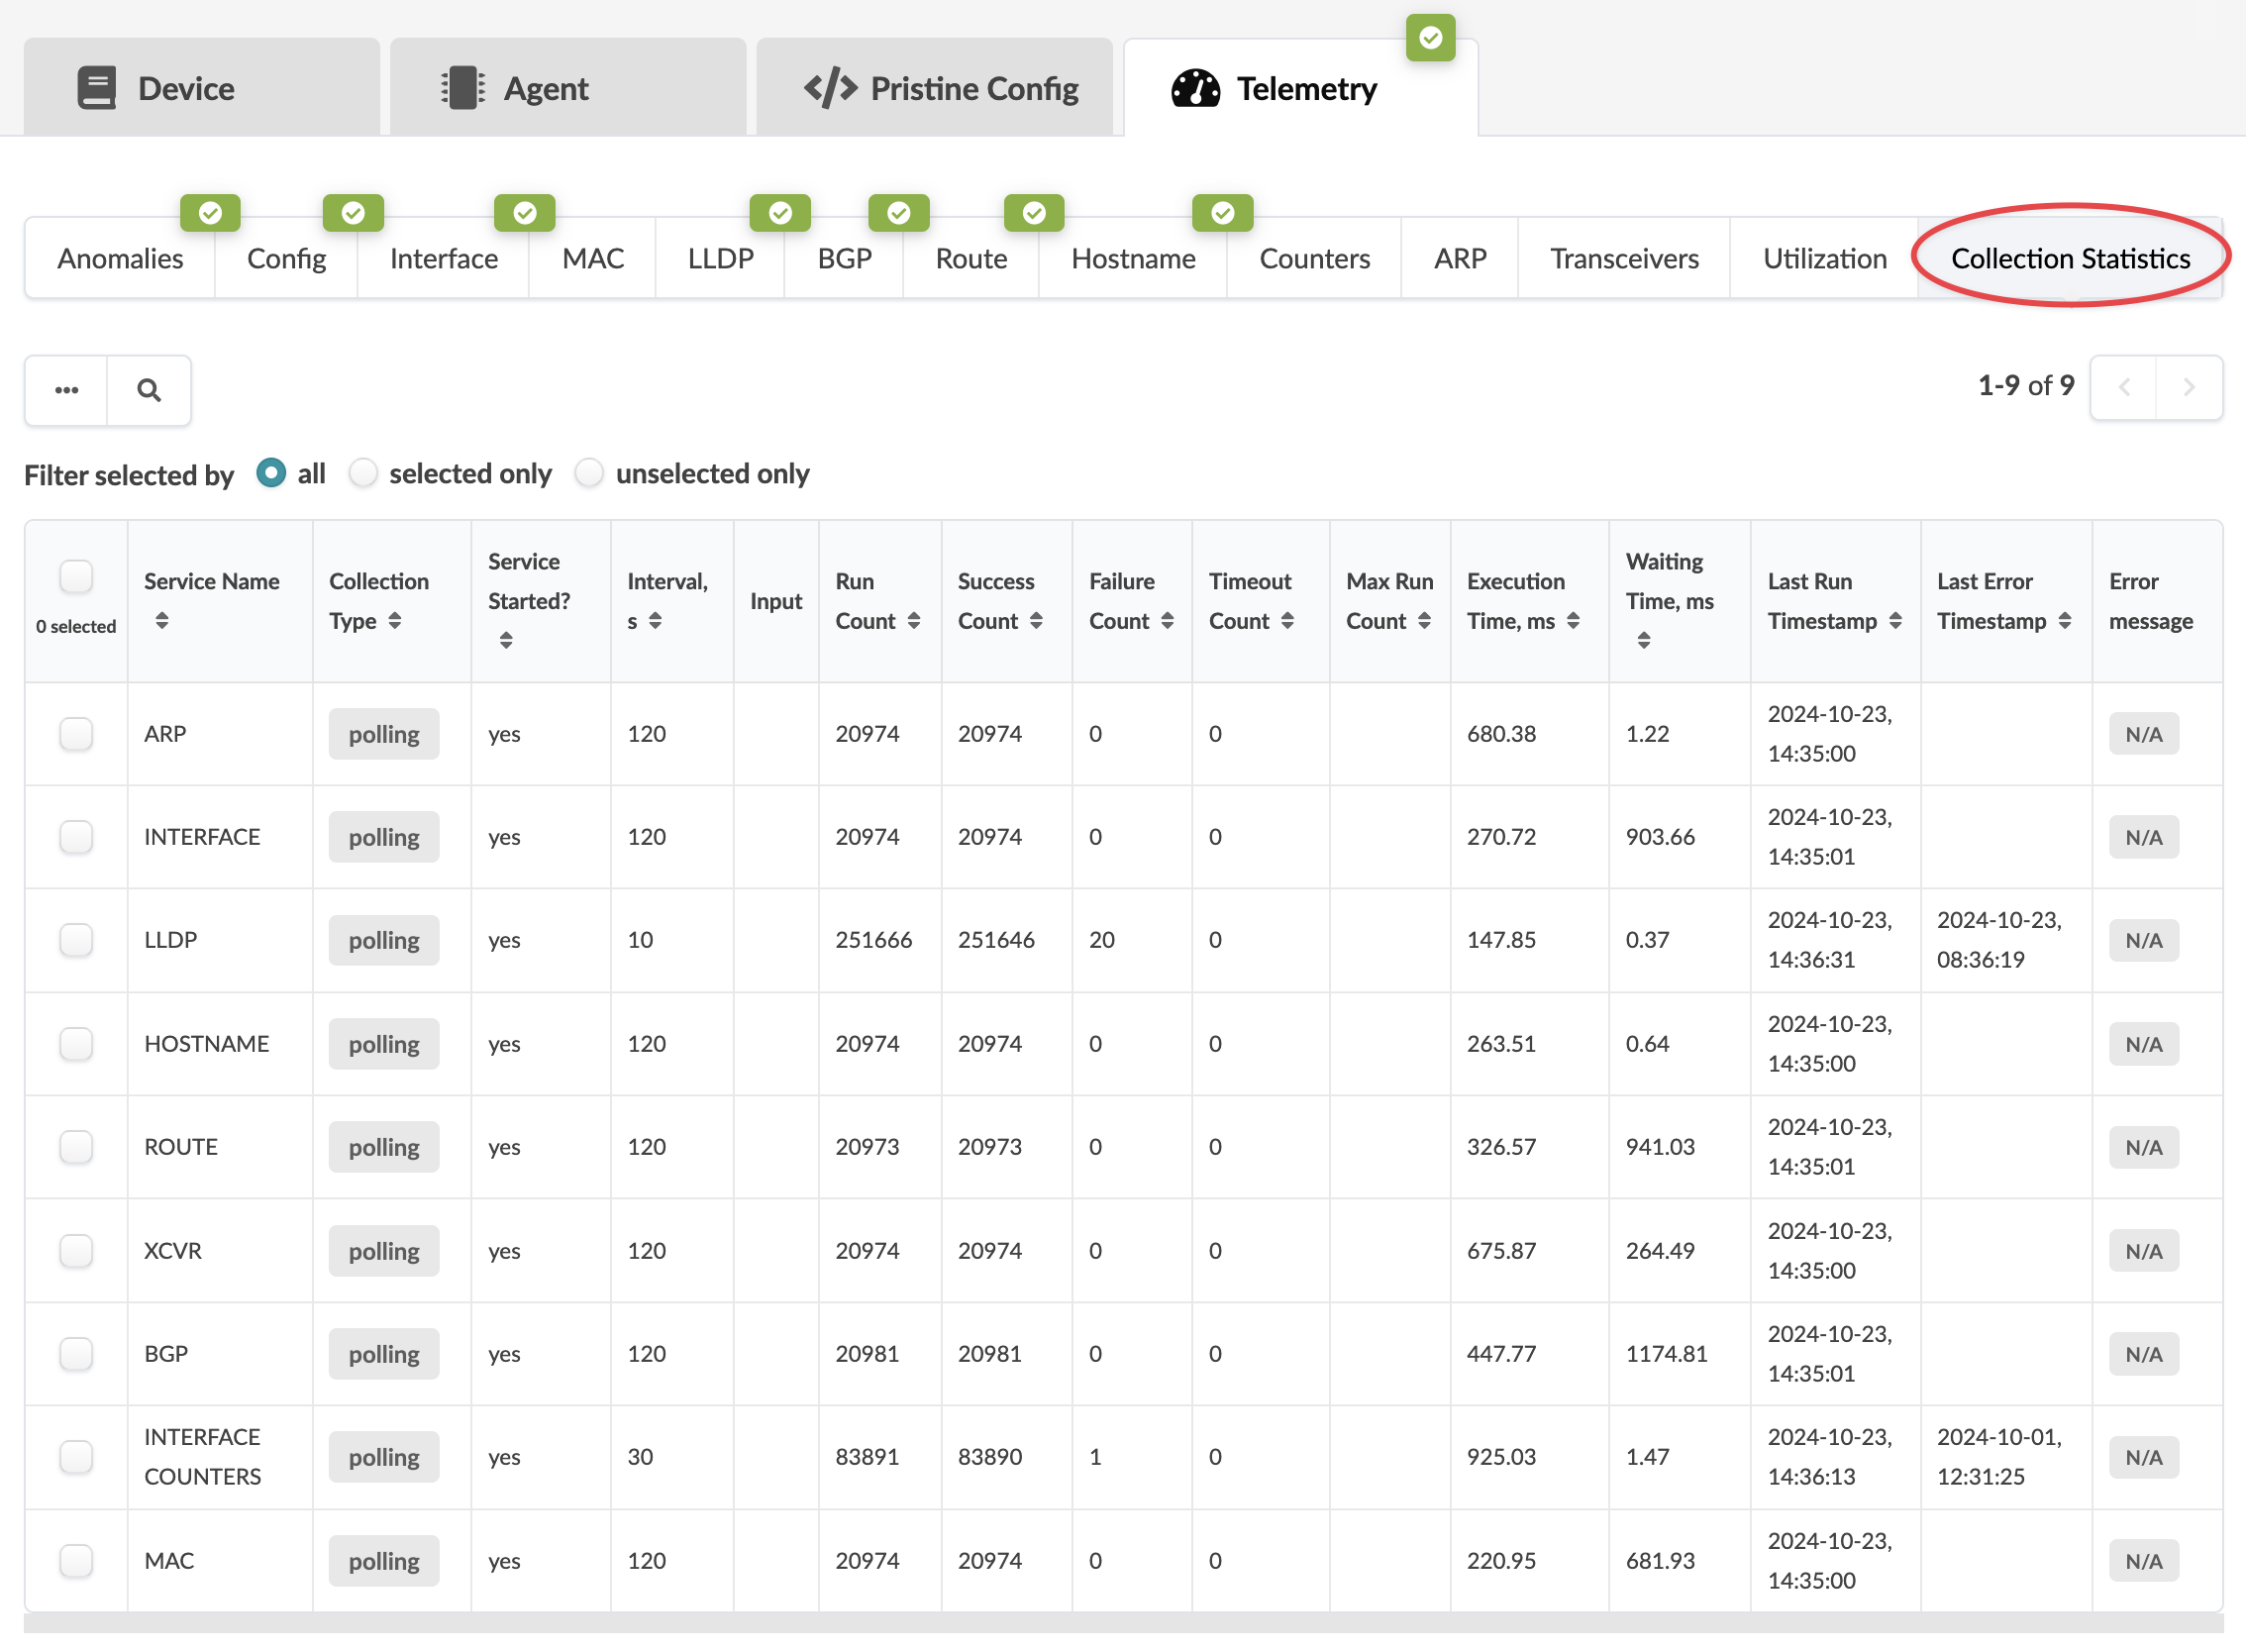
Collection Statistics
Click the Collection Statistics tab to see statistics details. See the table below for more information.
| Collection Statistics | Description |
|---|---|
| Service Name | The name of the service |
| Collection Type | polling or gRPC |
| Service Started? | Has the service started? |
| Interval | How frequently the service is configured to run on the device (in seconds) |
| Input | The input that is provided to the service for its processing |
| Run Count | The number of times the collector is scheduled to run |
| Success Count | The number of times the collector successfully executed |
| Failure Count | The number of times the collector failed execution |
| Timeout Count | The number of times the collector timed out |
| Max Run Count | User-specified maximum number of times for the collector to run |
| Execution Time | The time it took for collection during the last iteration (in milliseconds) |
| Waiting Time | A device runs multiple collectors. If some collectors monopolize CPU, other collector executions are deferred. Waiting time is the amount of time that the collector was deferred (in milliseconds). |
| Last Run Timestamp | Timestamp at which the collector was scheduled to run |
| Last Error Timestamp | Timestamp at which the collector last reported an error |
| Error message | Any error message from the last collector iteration. |
Refresh Telemetry Service
-
From the Collection Statistics tab, select the check
box(es) for one or more services, then click the Refresh selected
services button that appears above the table.
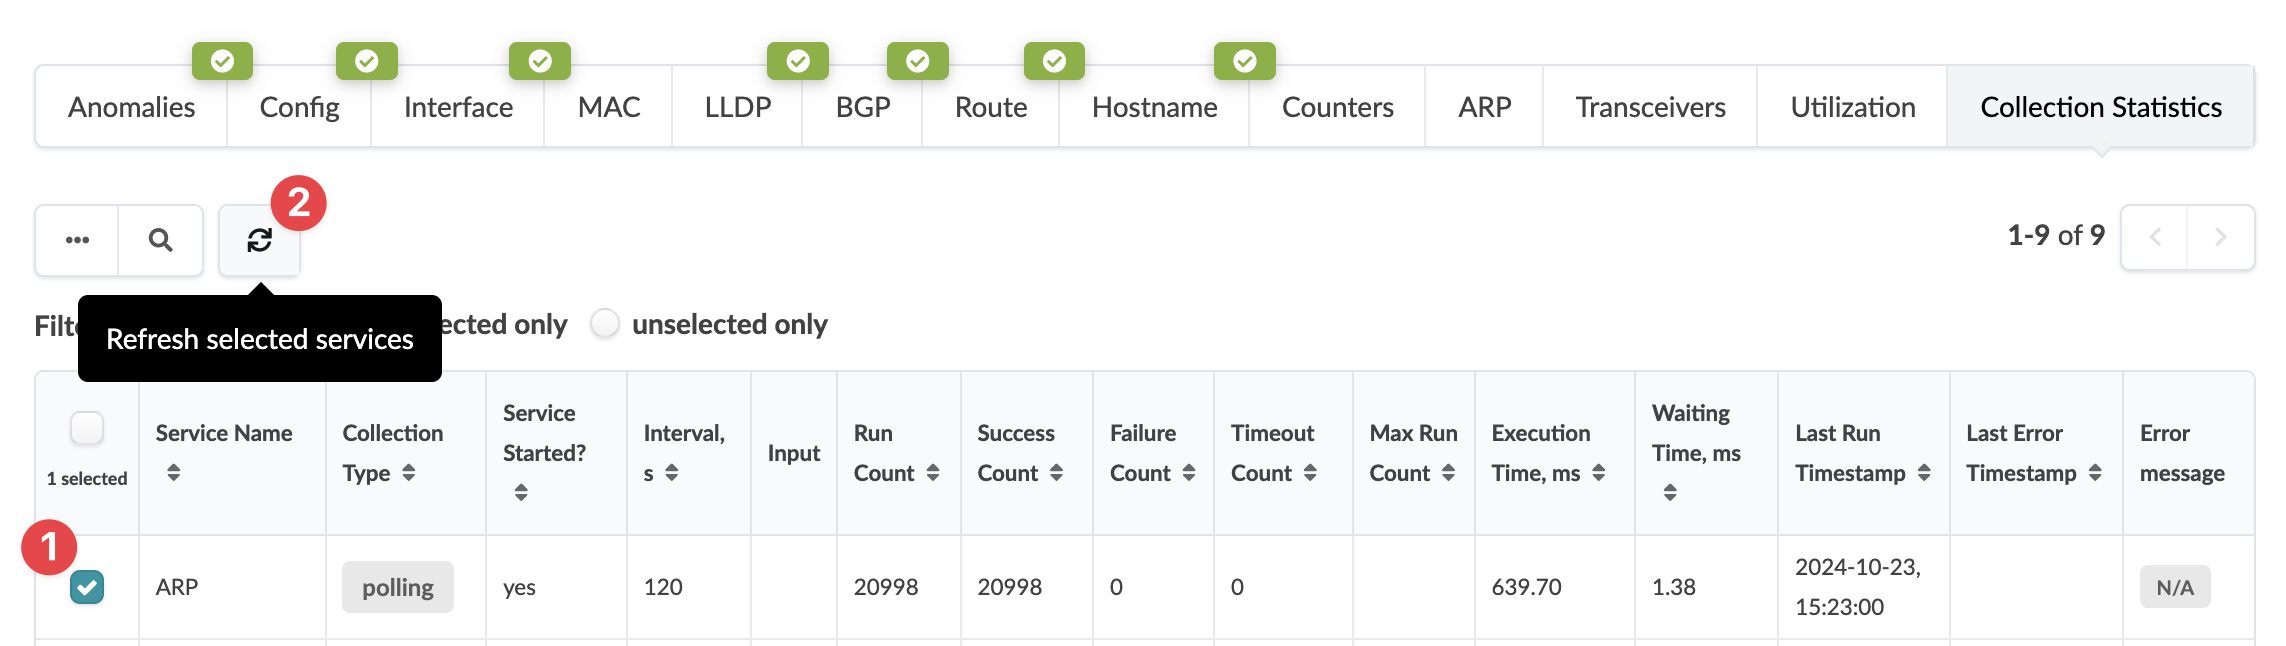 The Refresh Telemetry for Selected Services? dialog opens.