Monitor RRM
Learn about radio resource management (RRM) monitoring so you can see the effects of RRM on your wireless network.
What Mist RRM Shows You
In the Juniper Mist GUI, you can see the status of, and interact with RRM by navigating to Site > Radio Management. At the top of the page, the site summary displays statistics about the current RF environment by frequency band. The site summary presents a quick look at the health of RRM for the selected site and radio band.

The band selector is highlighted in the image above. The data within the site summary is:
-
AVG. NOISE—The average noise floor of all the APs on the selected band. AVG. NOISE, when calculated with the signal strength of a radio on a given channel, gives the signal to noise ratio. Smaller numbers are better for AVG. NOISE.
-
AVG. # NEIGHBORS—This is the number of devices (other APs) assigned to the site and within range of a given AP. Higher numbers indicate a denser network. The potential benefits of dense networks are increased routing options in mesh networks and enhanced network connectivity. On of the potential downsides of dense networks is higher power consumption.
-
AVG. # CO-CHANNEL NEIGHBORS—This is the number of neighbor AP radios assigned to the site that are occupying the same channel. Higher numbers here could indicate poor throughput.
-
AVG. # APS PER CHANNEL—This is the average number of APs on a given channel. For 2.4 GHz networks where there are fewer channels to choose from, this number tends to be higher. On 5 GHz networks, this number tends to be lower because there are more channels to choose from. The higher the number of APs per channel, the more likely you are to encounter interference in the network, poor throughput, and increased power usage.
-
CHANNEL DIST. SCORE—This number refers to the distribution of occupied channels across APs. The number ranges from 0 to 1. 0 (bad) indicates uneven channel distribution with varying numbers of APs occupying each channel. 1 (good) indicates uniform channel distribution with channels occupied by a similar number of APs.
-
AP DENSITY—This number indicates how well the APs can hear each other. 0 means no APs can hear each other and 1 means all APs can hear each other. Lower numbers mean decreased potential for interference but increased potential for connectivity gaps, throughput and roaming problems. Higher numbers mean denser, more complete coverage, and better throughput, but may present increased risk of co-channel interference
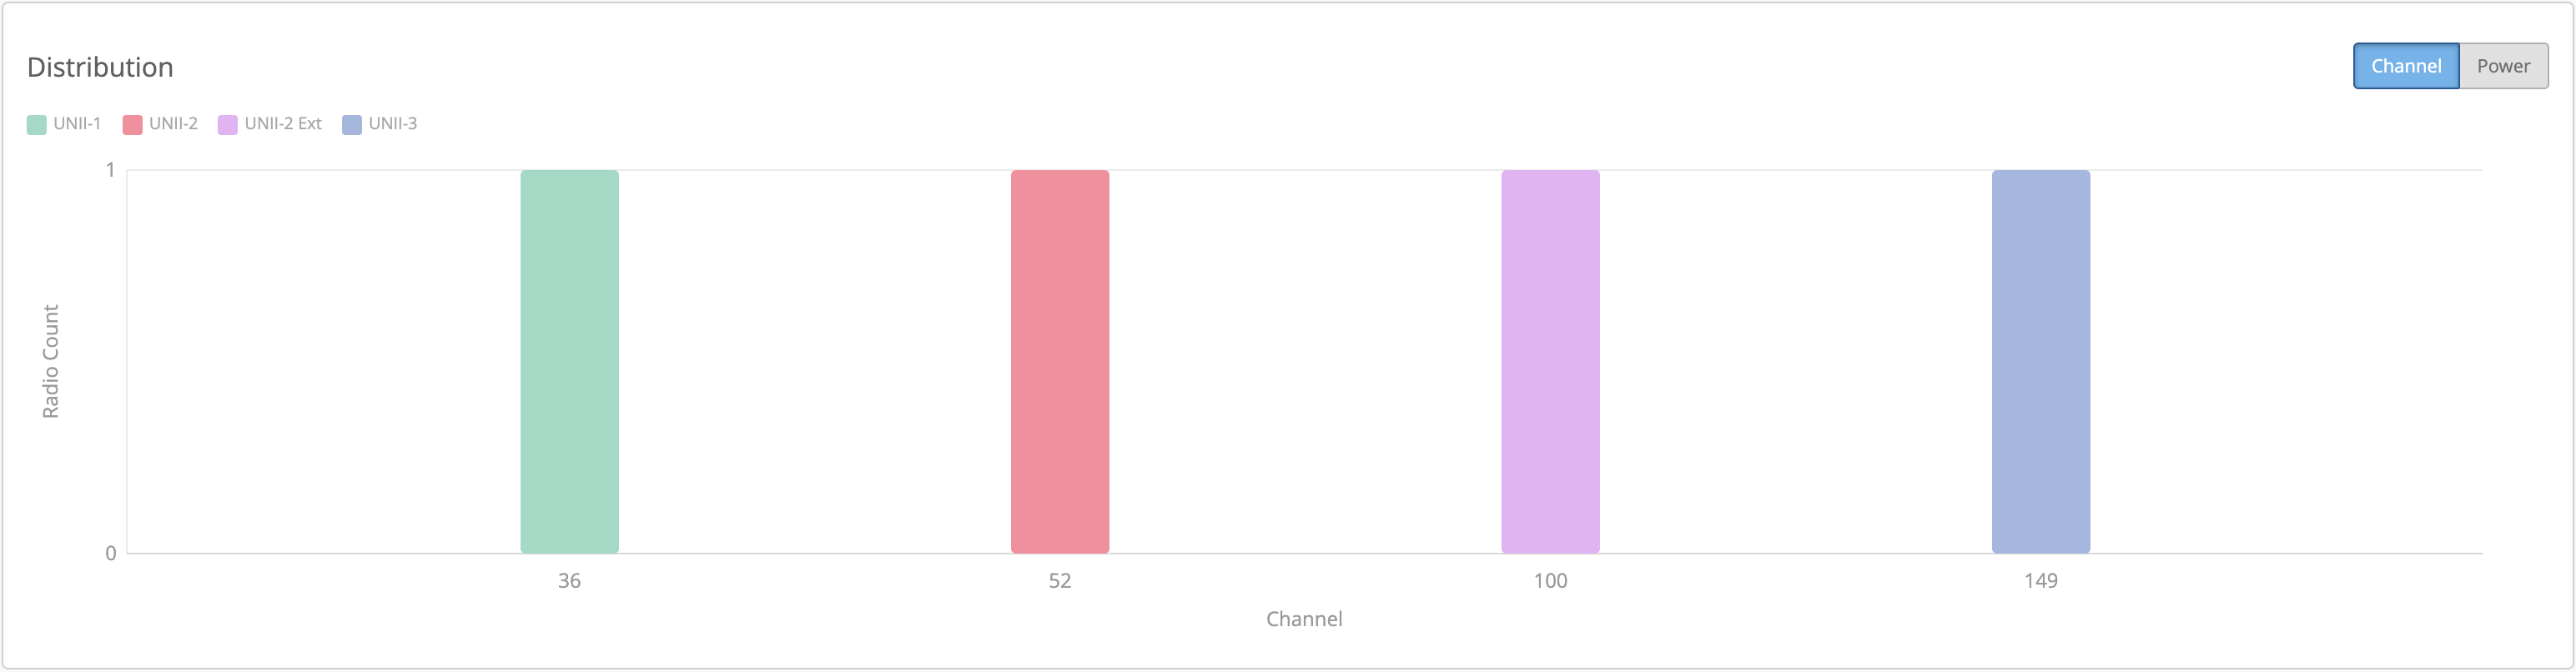
The Distribution block shows the number of radios broadcasting on a given channel or the power settings for those radios on the selected band.
In the image below, we can see that each of four radios are occupying only one 5 GHz channel in this network. If the radio count was higher on any channel, it could be an indication of possible co-channel interference.
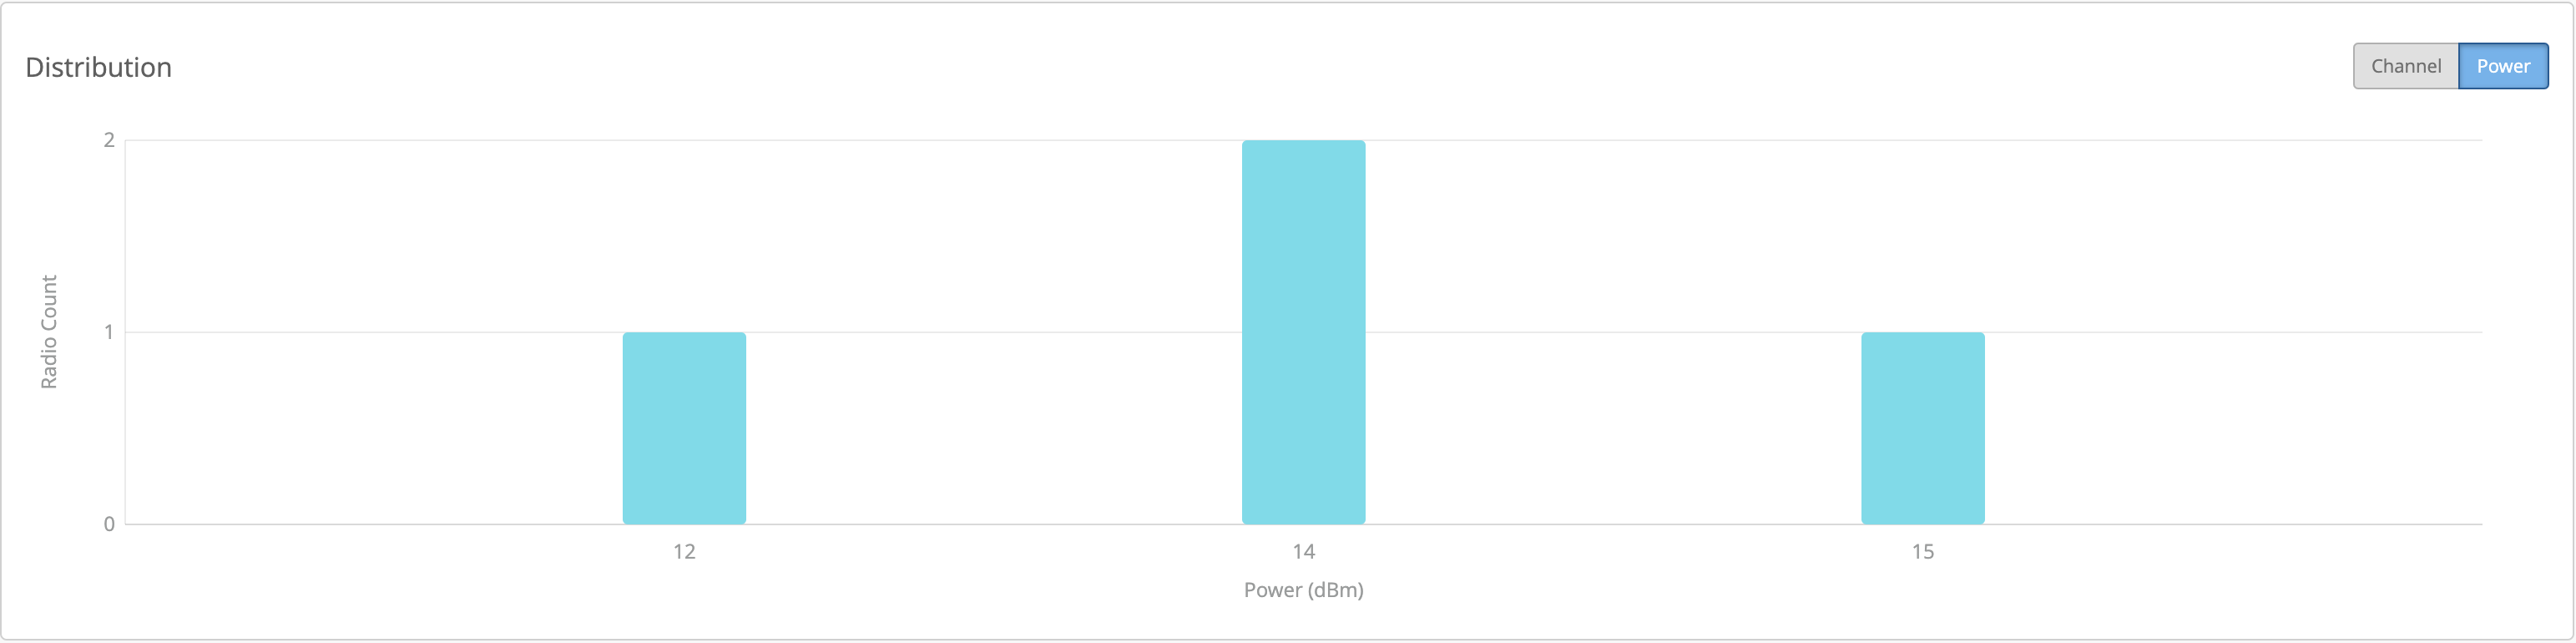
The next image shows the same four AP's power distribution. In this case 2 radios in the 5 GHz band are transmitting at 14 dBm, one at 12 dBm, and one at 15 dBm. In this case, these power settings are automatically controlled by RRM.
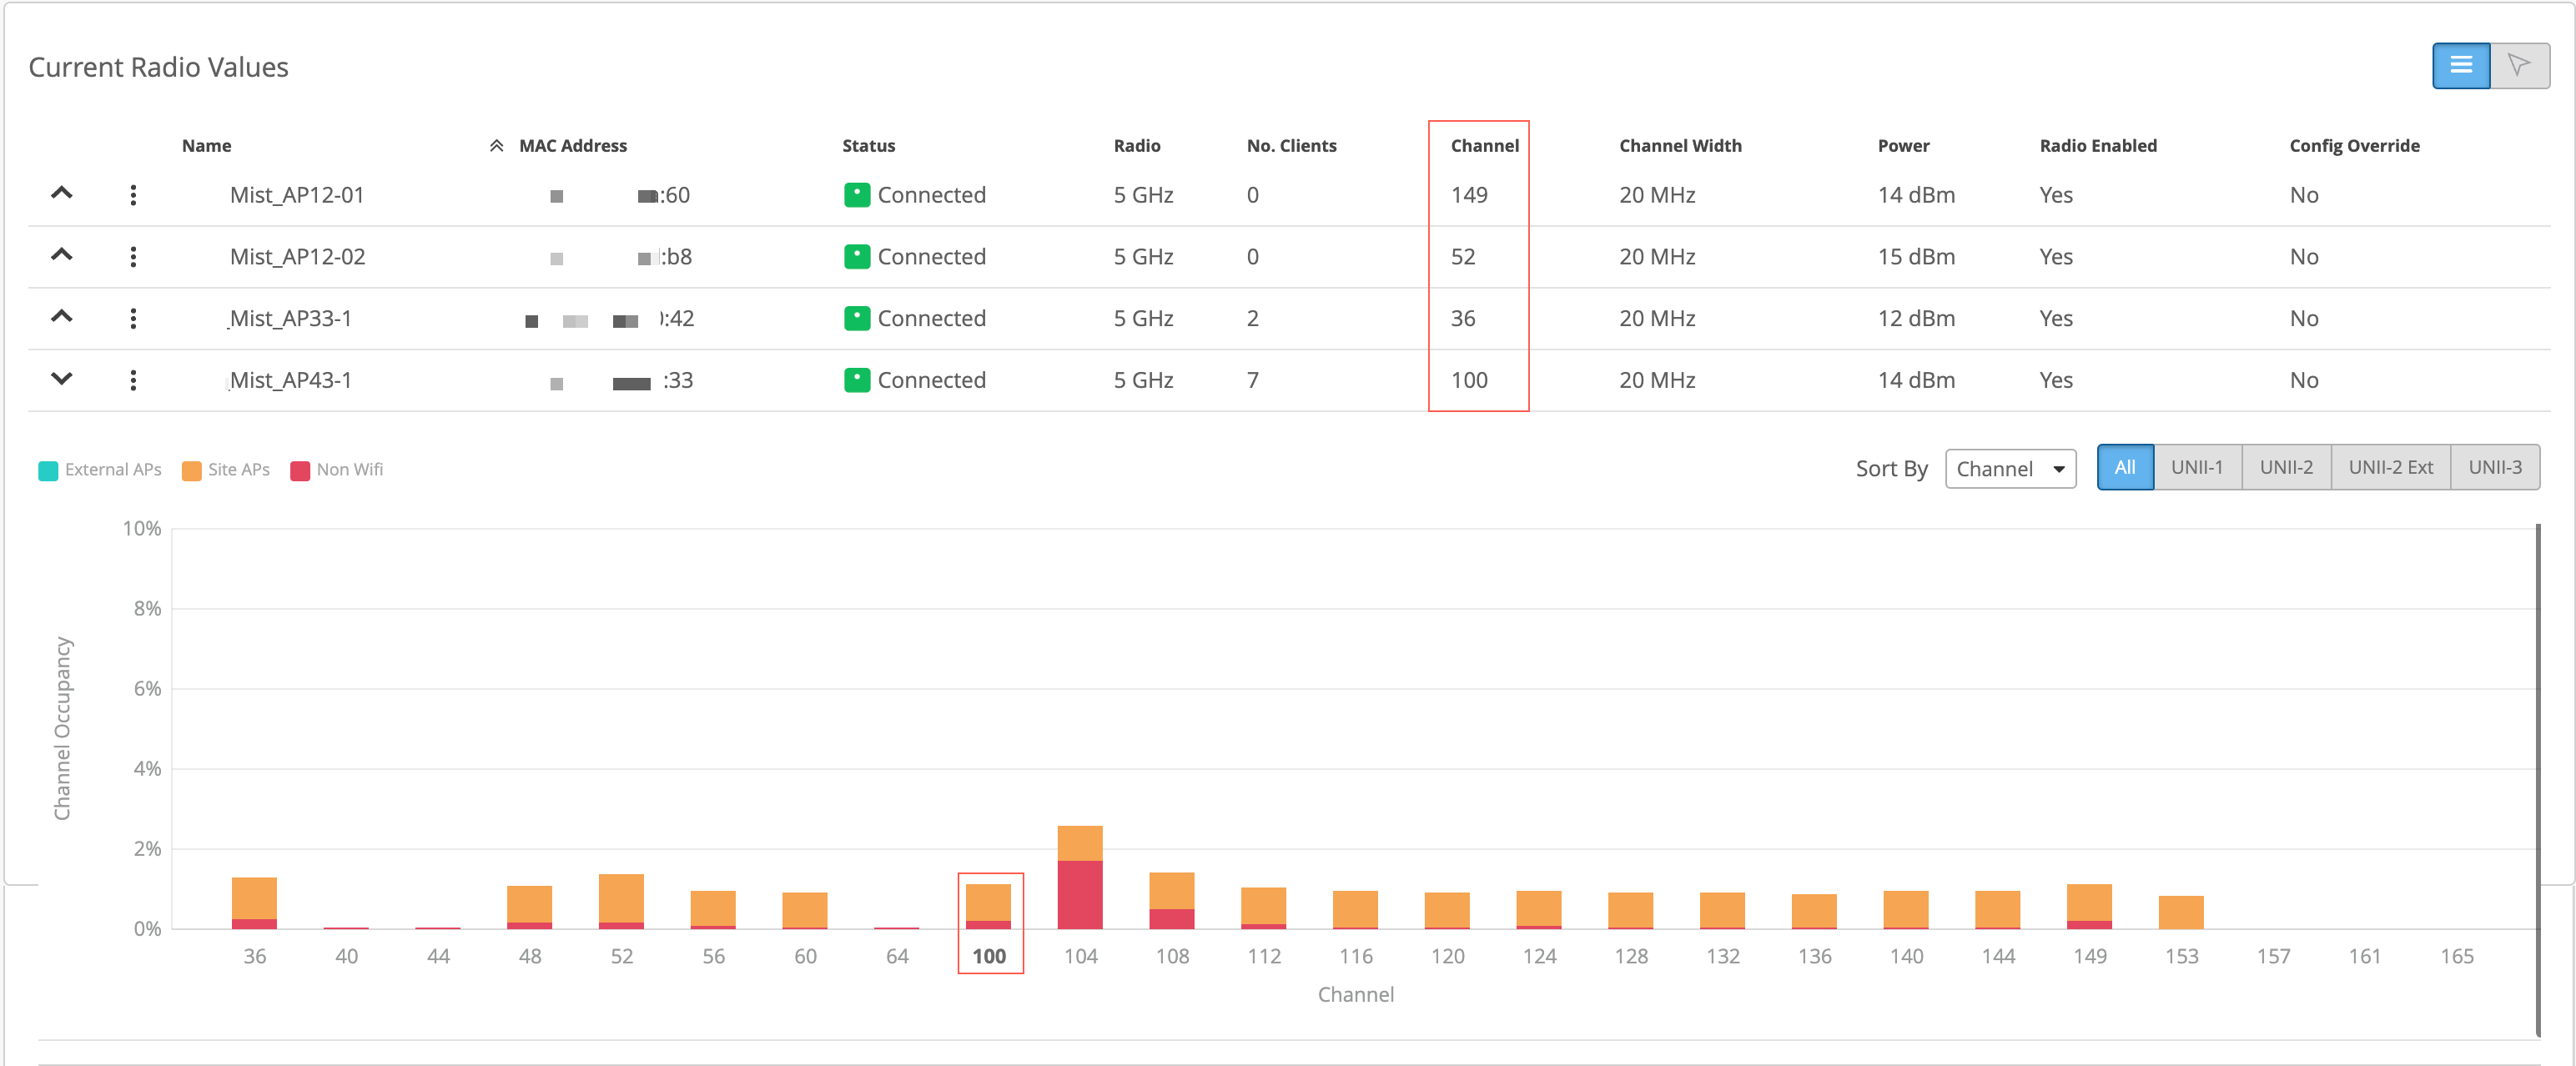
The Current Radio Values block initially shows a collapsed view of each APs radio settings for the selected band. On the left side, the up-arrow indicates a collapsed view for that particular AP. When the arrow points down, you can see channel occupancy from the perspective of the selected AP. This expanded view shows all the channels available on the selected band. The channel that the selected AP is broadcasting on is shown in bold.
Optionally, you can display the same current radio value information on a location map by clicking the left-pointing arrow at the upper right side of the Current Radio Values block:
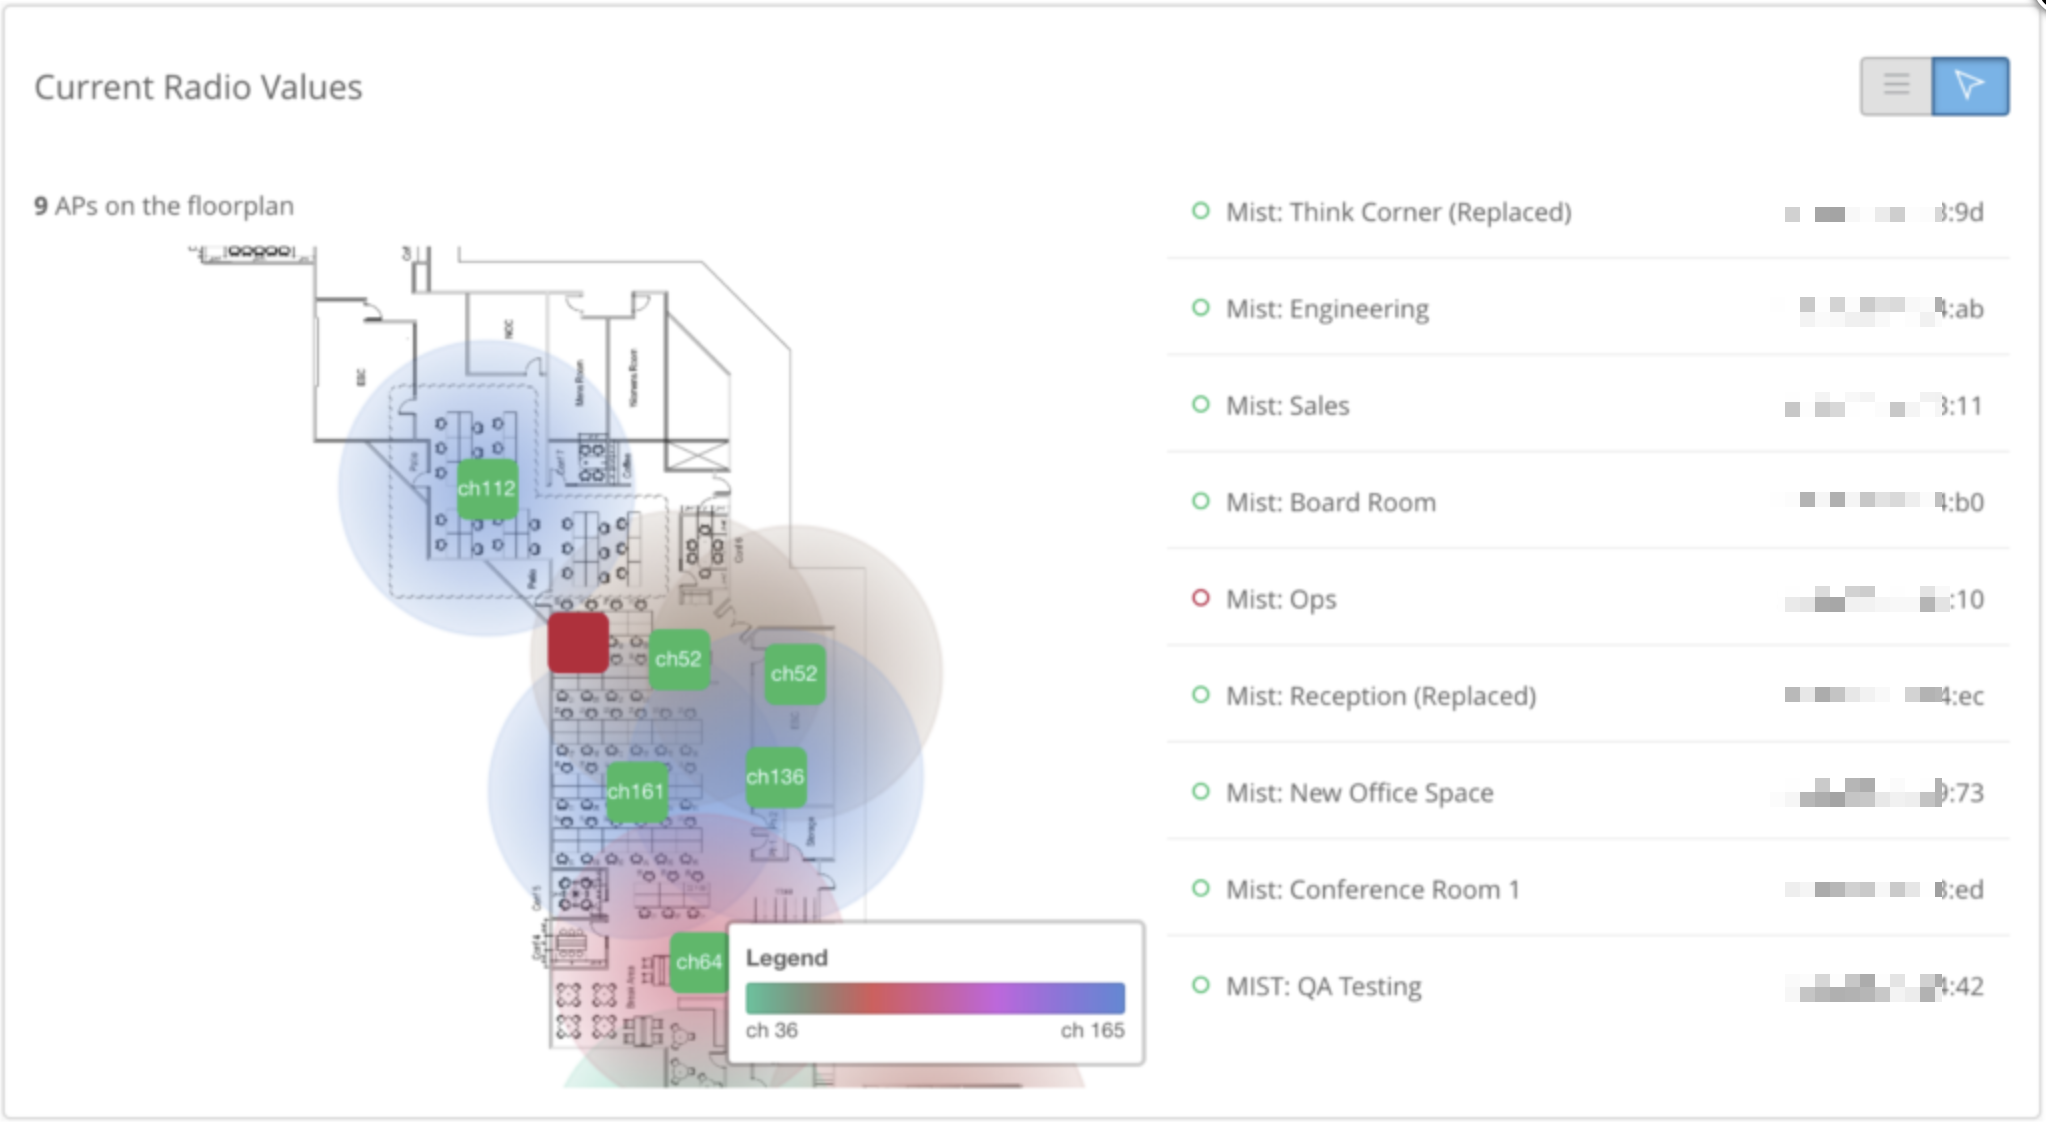
You must have your location information, including a map with AP placement, entered into the Mist portal for your site before you can see the location-based radio values information. The location-based radio values image shown above is from the Mist offices and shows a different set of APs than the previous images.
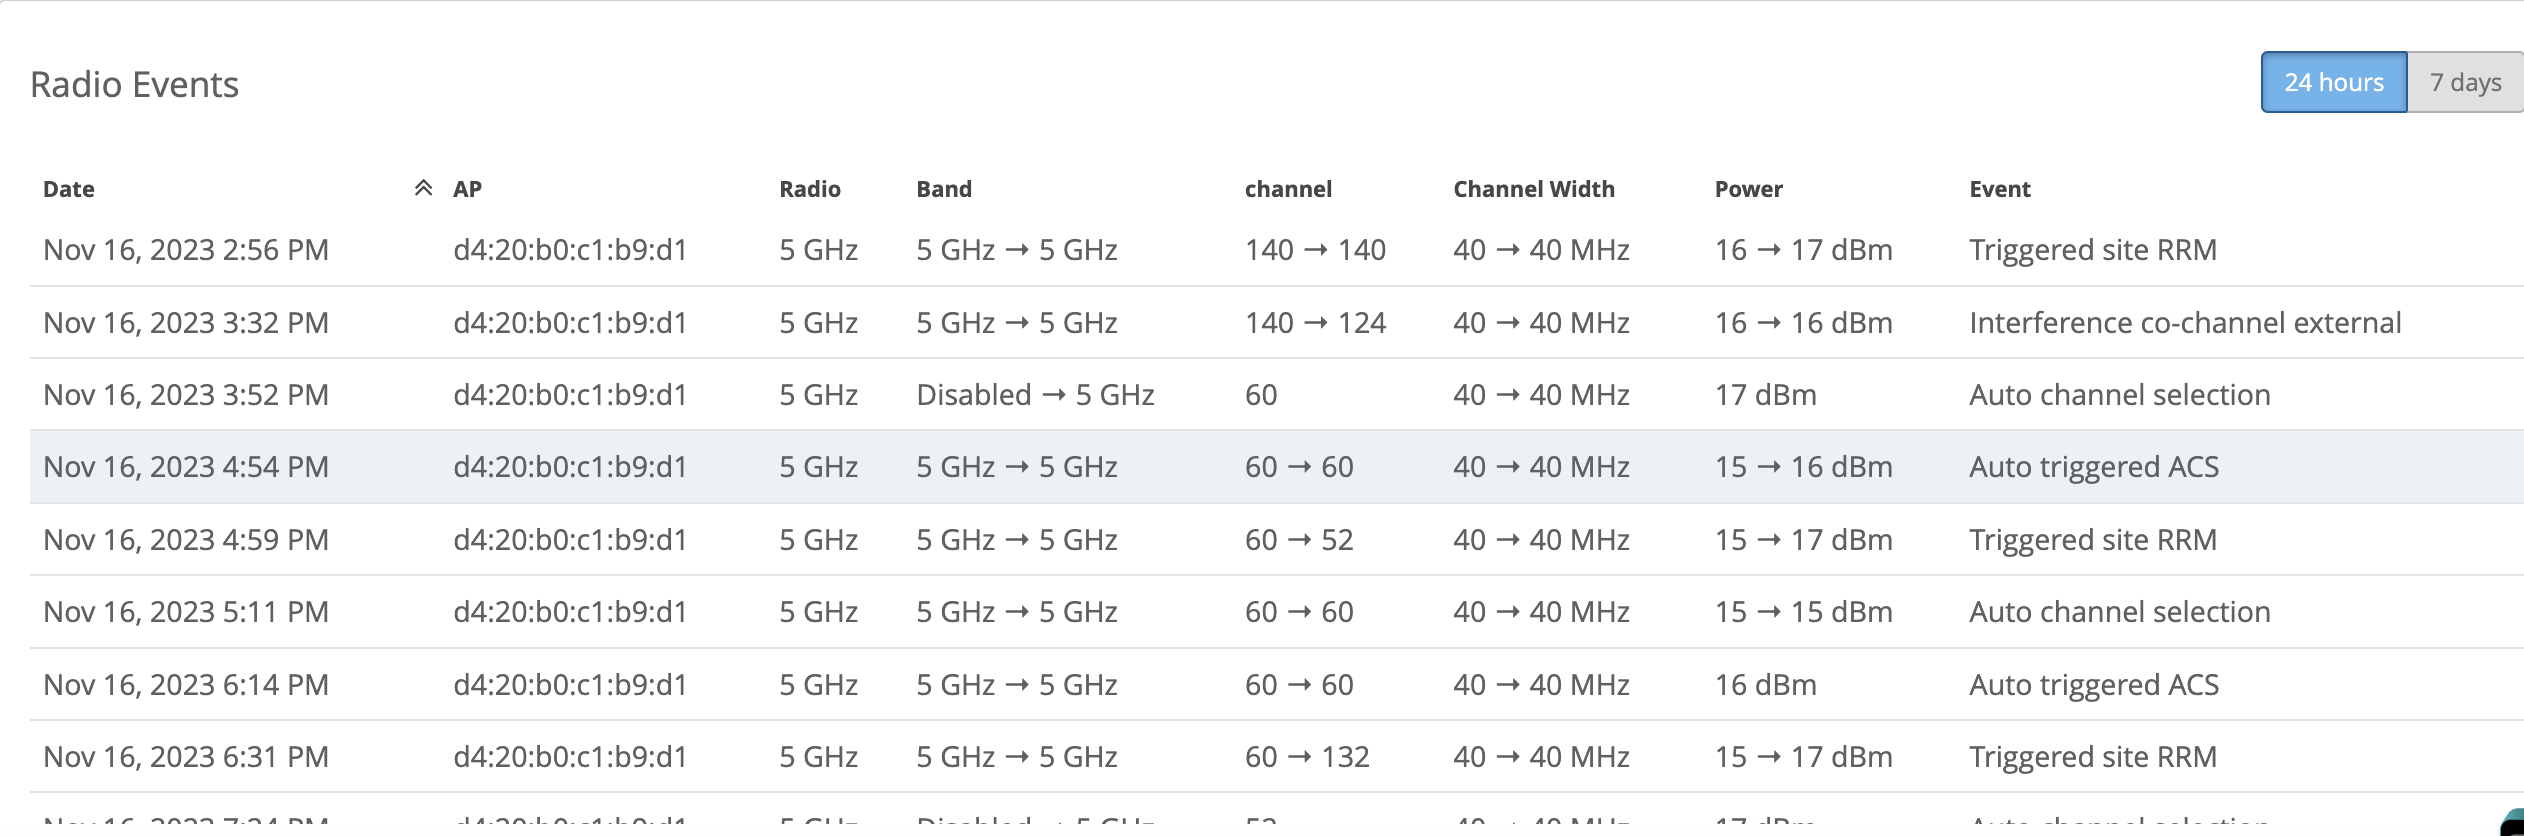
The Radio Events block shows you RRM events for the last 24 hours or the last 7 days. Here you can see the channel, bandwidth, and power of your APs as well as what triggered any change. Shown under the Events column, change triggers range from Scheduled site RRM, Triggered site RRM, Radar detected, co-channel interference, etc. The image below shows several radio events in the last 7 days.
See RRM Configuration Options for configuration options and hierarchies.
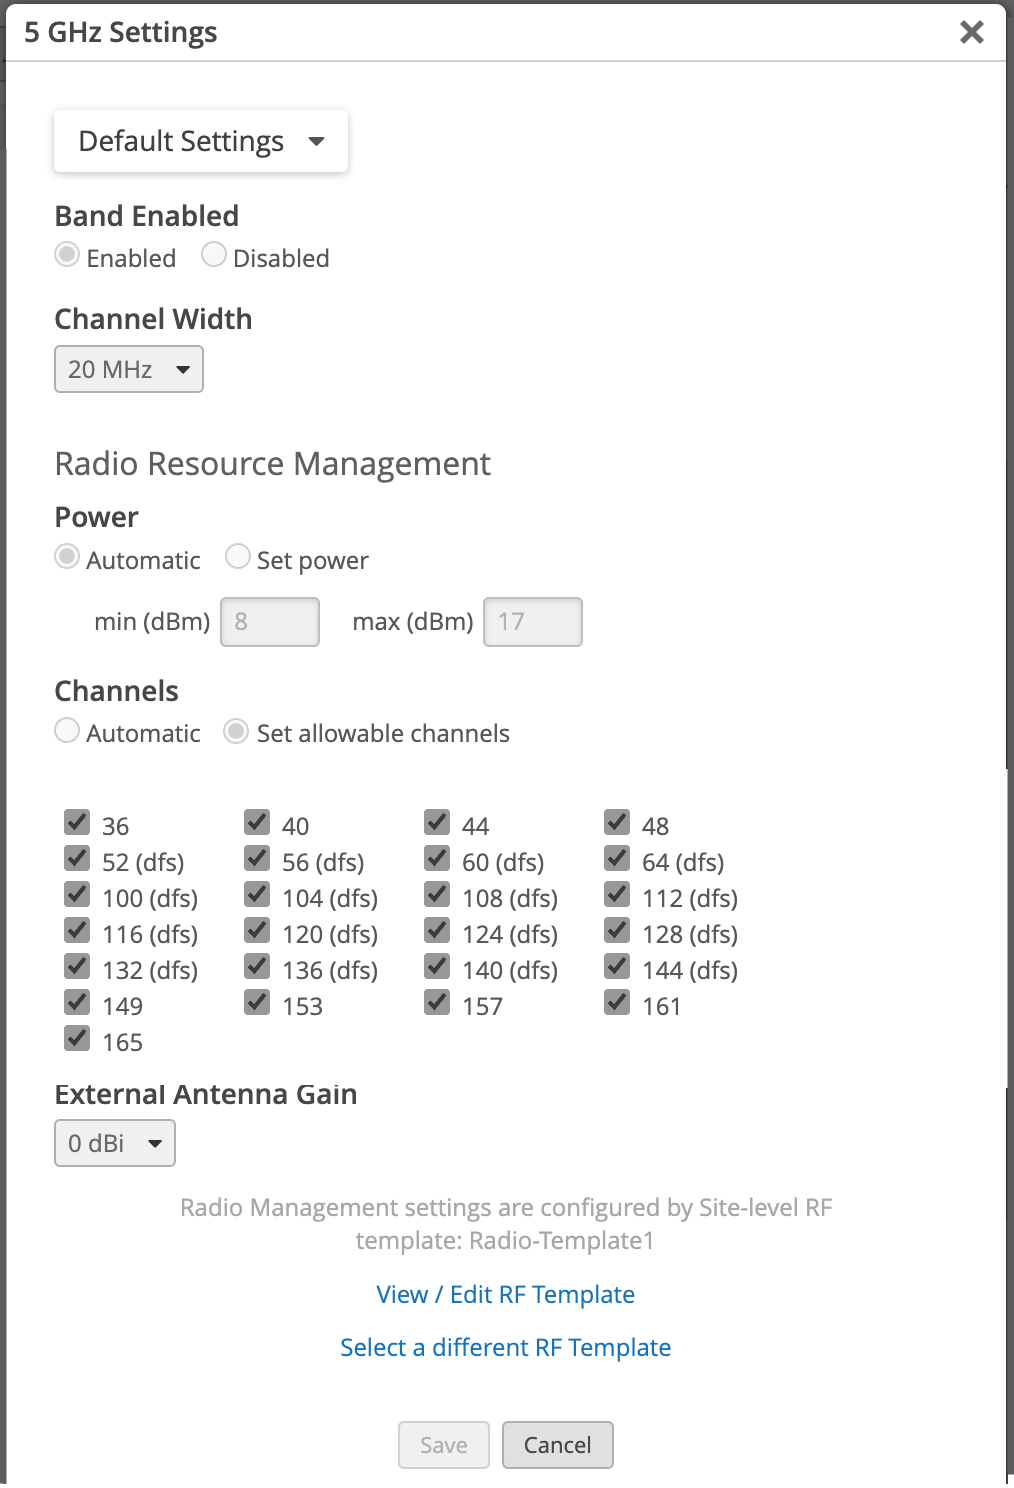
You can see the radio settings for the selected band by clicking the Radio Management button at the top right of the page, as shown in the Figure 1 image.
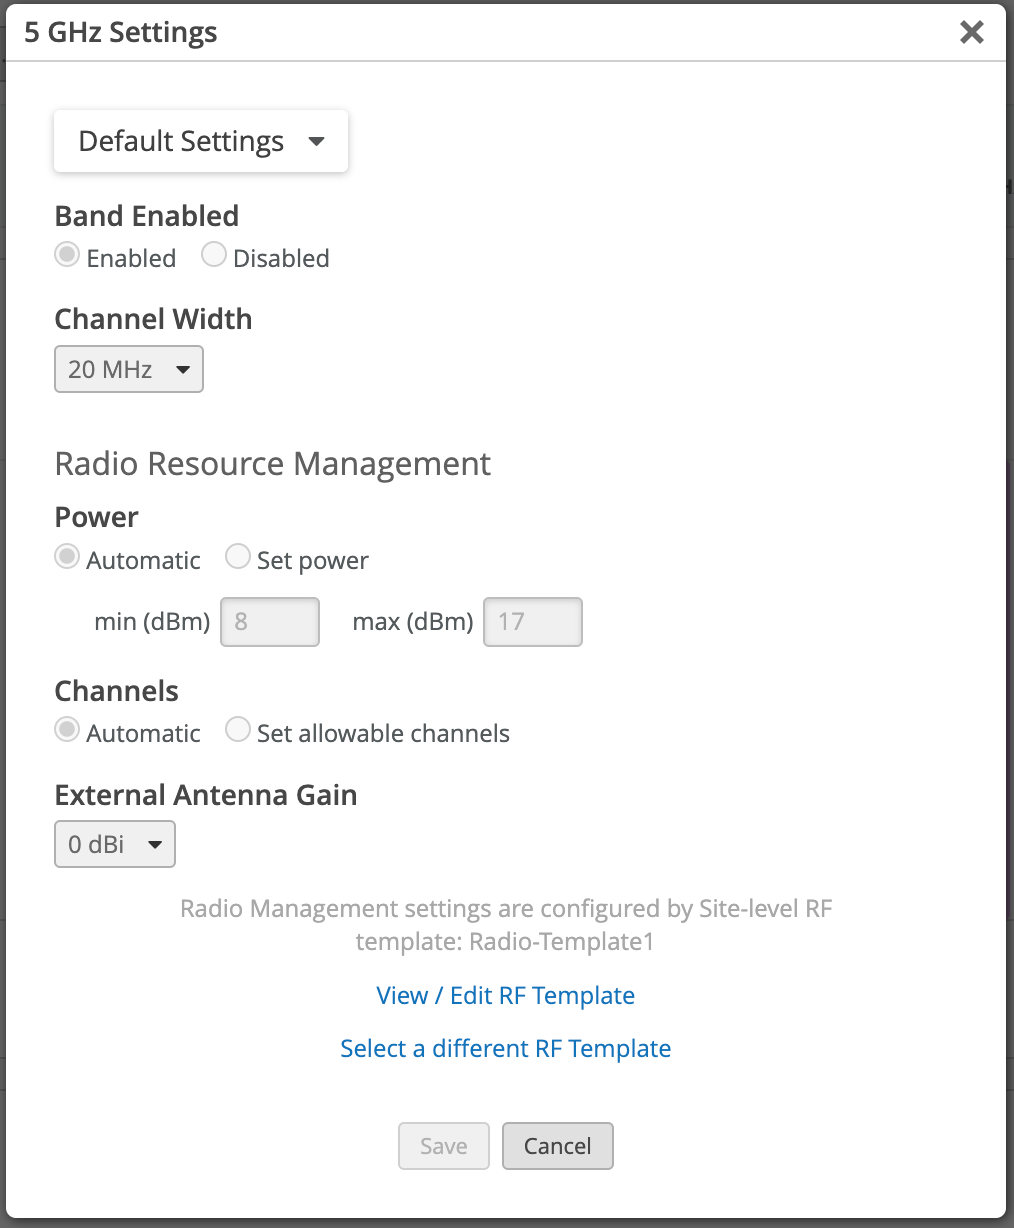
At the bottom of the pop-up window, you can see which Site-level RF Template manages band enablement, channel width, power, and channel settings for this site. In this case, Radio Template1 has everything set to auto. This means that RRM is free to manage all of the settings as needed. If any of the template settings were set to manual, you would see different options in the Radio Management settings window: