- Introduction
- Get Started
- play_arrow Apstra GUI
- play_arrow Blueprints and Dashboard
- play_arrow Staged (Datacenter Blueprints)
- Blueprint-Wide Search
- play_arrow Physical
- play_arrow Build
- play_arrow Selection
- play_arrow Topology
- play_arrow Nodes
- Nodes (Datacenter)
- Unassign Device (Datacenter)
- Update Deploy Mode (Datacenter)
- Generic Systems vs. External Generic Systems
- Create Generic System
- Create External Generic System
- Create Access Switch
- Update Node Tag (Datacenter)
- Update Port Channel ID Range
- Update Hostname (Datacenter)
- Edit Generic System Name
- Edit Device Properties (Datacenter)
- View Node's Static Routes
- Delete Node
- play_arrow Links
- Links (Datacenter)
- Add Links to Leaf
- Add Links to Spine
- Add Links to Generic System
- Add Links to External Generic System
- Add Leaf Peer Links
- Add Link per Superspine (5-Stage)
- Form LAG
- Create Link in LAG
- Break LAG
- Update LAG Mode
- Update Link Tag (Datacenter)
- Update Link Speed
- Update Link Speed per Superspine (5-Stage)
- Mixed Link Speeds between Leaf and Spine
- Update Link Properties
- Delete Link (Datacenter)
- Export Cabling Map (Datacenter)
- Import Cabling Map (Datacenter)
- Edit Cabling Map (Datacenter)
- Fetch LLDP Data (Datacenter)
- play_arrow Interfaces
- play_arrow Racks
- play_arrow Pods
- play_arrow Planes
-
- play_arrow Virtual
- play_arrow Virtual Networks
- play_arrow Routing Zones
- Static Routes (Virtual)
- Protocol Sessions (Virtual)
- play_arrow Virtual Infrastructure
- play_arrow Statistics
-
- play_arrow Policies
- play_arrow Endpoints
- Security Policies
- Interface Policies
- Routing Policies
- Routing Zone (VRF) Constraints
- play_arrow Routing Zone Policy (4.2.0)
-
- play_arrow Data Center Interconnect (DCI)
- play_arrow Catalog
- play_arrow Logical Devices
- play_arrow Interface Maps
- play_arrow Property Sets
- play_arrow Configlets
- play_arrow AAA Servers
- play_arrow Tags
-
- play_arrow Tasks
- play_arrow Connectivity Templates
- Connectivity Templates Introduction
- play_arrow Primitives
- Primitive: Virtual Network (Single)
- Primitive: Virtual Network (Multiple)
- Primitive: IP Link
- Primitive: Static Route
- Primitive: Custom Static Route
- Primitive: BGP Peering (IP Endpoint)
- Primitive: BGP Peering (Generic System)
- Primitive: Dynamic BGP Peering
- Primitive: Routing Policy
- Primitive: Routing Zone Constraint
- User-defined
- Pre-defined
- Create Connectivity Template for Multiple VNs on Same Interface (Example)
- Create Connectivity Template for Layer 2 Connected External Router (Example)
- Update Connectivity Template Assignments
- Edit Connectivity Template
- Delete Connectivity Template
- play_arrow Fabric Settings (4.2.1)
- play_arrow Fabric Policy (4.2.1)
- play_arrow Severity Preferences (4.2.1)
-
- play_arrow Fabric Settings (4.2.0)
- play_arrow Fabric Policy (4.2.0)
- play_arrow Virtual Network Policy (4.2.0)
- play_arrow Anti-Affinity Policy (4.2.0)
- play_arrow Validation Policy (4.2.0)
-
- BGP Route Tagging
- play_arrow Staged (Freeform Blueprints)
- Freeform Introduction
- play_arrow Blueprints
- play_arrow Physical
- play_arrow Selection
- play_arrow Topology
- play_arrow Systems
- Systems Introduction (Freeform)
- Create Internal System (Freeform)
- Create External System (Freeform)
- Update Config Template Assignment (Freeform)
- Update System Name (Freeform)
- Update Hostname (Freeform)
- Update Device Profile Assignment (Freeform)
- Update System ID Assignment (Freeform)
- Update Deploy Mode (Freeform)
- Update System Tag Assignment (Freeform)
- Delete System (Freeform)
- Device Context (Freeform)
- play_arrow Links
-
- play_arrow Resource Management
- Resource Management Introduction (Freeform)
- play_arrow Blueprint Resources
- play_arrow Allocation Groups
- play_arrow Local Pools
- play_arrow Catalog
- play_arrow Config Templates
- play_arrow Device Profiles
- play_arrow Property Sets
- play_arrow Tags
-
- play_arrow Tasks
- play_arrow Uncommitted (Blueprints)
- play_arrow Active (Datacenter Blueprints)
- play_arrow Time Voyager (Blueprints)
- play_arrow Devices
- Device Configuration Lifecycle
- play_arrow Managed Devices
- play_arrow System Agents
- play_arrow Pristine Config
- play_arrow Telemetry
- play_arrow Apstra ZTP
- Apstra ZTP Introduction
- Create User Profile for Communicating with ZTP Server
- Download and Deploy Apstra ZTP Server VM
- Configure Static Management IP Address for Apstra ZTP Server
- Replace SSL Certificate for Apstra ZTP Server GUI
- Configure Credentials for Apstra ZTP Server GUI
- Create Vendor-specific Custom Configuration
- Configure Apstra Server Connection Details
- Configure DHCP Server for Apstra ZTP
- ztp.json Keys
- Configure ztp.json with Configurator
- Configure ztp.json with CLI
- Onboard Devices with Apstra ZTP
- Check ZTP Status of Devices and Services
- Reset Apstra ZTP GUI Admin Password
- play_arrow Device Profiles
- play_arrow Design
- play_arrow Logical Devices
- play_arrow Interface Maps
- play_arrow Rack Types
- play_arrow Templates
- play_arrow Config Templates
- play_arrow Configlets (Datacenter)
- play_arrow Property Sets (Datacenter)
- play_arrow TCP/UDP Ports
- play_arrow Tags
-
- play_arrow Resources
- play_arrow Analytics
- play_arrow Apstra Flow
- Apstra Flow Introduction
- System Requirements
- play_arrow Dashboards
- play_arrow Supported Flow Records
- play_arrow Flow Enrichment
- play_arrow Monitor Flow Data
- play_arrow Configuration Reference
- play_arrow API
- play_arrow Additional Documentation
- play_arrow Knowledge Base
-
- play_arrow External Systems (RBAC Providers)
- play_arrow Providers
- play_arrow Provider Role Mapping
-
- play_arrow Platform
- play_arrow User / Role Management
- play_arrow Security
- Syslog Configuration (Platform)
- Receivers (Platform)
- Global Statistics (Platform)
- Event Log (Audit Log)
- play_arrow Apstra VM Clusters
- play_arrow Developers
- play_arrow Technical Support
- Check Apstra Versions and Patent Numbers
-
- Favorites & User
- play_arrow Apstra Server Management
- Apstra Server Introduction
- Monitor Apstra Server via CLI
- Restart Apstra Server
- Reset Apstra Server VM Password
- Reinstall Apstra Server
- Apstra Database Overview
- Back up Apstra Database
- Restore Apstra Database
- Reset Apstra Database
- Migrate Apstra Database
- Replace SSL Certificate on Apstra Server with Signed One
- Replace SSL Certificate on Apstra Server with Self-Signed One
- Change Apstra Server Hostname
- Apstra CLI Utility
- play_arrow Guides
- play_arrow References
- play_arrow Feature Matrix
- play_arrow Devices
- play_arrow Analytics
- play_arrow Predefined Dashboards (Analytics)
- play_arrow Predefined Probes (Analytics)
- Probe: BGP Monitoring
- Probe: Bandwidth Utilization
- Probe: Critical Services: Utilization, Trending, Alerting
- Probe: Device Environmental Checks
- Probe: Device System Health
- Probe: Device Telemetry Health
- Probe: Device Traffic
- Probe: Drain Traffic Anomaly
- Probe: ECMP Imbalance (External Interfaces)
- Probe: ECMP Imbalance (Fabric Interfaces)
- Probe: ECMP Imbalance (Spine to Superspine Interfaces)
- Probe: ESI Imbalance
- Probe: EVPN Host Flapping
- Probe: EVPN VXLAN Type-3 Route Validation
- Probe: EVPN VXLAN Type-5 Route Validation
- Probe: External Routes
- Probe: Hot/Cold Interface Counters (Fabric Interfaces)
- Probe: Hot/Cold Interface Counters (Specific Interfaces)
- Probe: Hot/Cold Interface Counters (Spine to Superspine Interfaces)
- Probe: Hypervisor and Fabric LAG Config Mismatch Probe (Virtual Infra)
- Hypervisor and Fabric VLAN Config Mismatch Probe (Virtual Infra)
- Probe: Hypervisor MTU Mismatch Probe (Virtual Infra - NSX-T Only)
- Probe: Hypervisor MTU Threshold Check Probe (Virtual Infra)
- Probe: Hypervisor Missing LLDP Config Probe (Virtual Infra)
- Probe: Hypervisor Redundancy Checks Probe (Virtual Infra)
- Probe: Interface Flapping (Fabric Interfaces)
- Probe: Interface Flapping (Specific Interfaces)
- Probe: Interface Policy 802.1x
- Probe: LAG Imbalance
- Probe: Leafs Hosting Critical Services: Utilization, Trending, Alerting
- Probe: Link Fault Tolerance in Leaf and Access LAGs
- Probe: MLAG Imbalance
- Probe: Multiagent Detector
- Probe: Optical Transceivers
- Probe: Packet Discard Percentage
- Probe: Spine Fault Tolerance
- Probe: Total East/West Traffic
- Probe: VMs without Fabric Configured VLANs Probe (Virtual Infra)
- Probe: VXLAN Flood List Validation
- play_arrow Probe Processors (Analytics)
- Processor: Accumulate
- Processor: Average
- Processor: Comparison
- Processor: EVPN Type 3
- Processor: EVPN Type 5
- Processor: Extensible Service Data Collector
- Processor: Generic Graph Collector
- Processor: Generic Service Data Collector
- Processor: Interface Counters
- Processor: Logical Operator
- Processor: Match Count
- Processor: Match Percentage
- Processor: Match String
- Processor: Max
- Processor: Min
- Processor: Periodic Average
- Processor: Range
- Processor: Ratio
- Processor: Service Data Collector
- Processor: Set Comparison
- Processor: Set Count
- Processor: Standard Deviation
- Processor: State
- Processor: Subtract
- Processor: Sum
- Processor: System Utilization
- Processor: Time in State
- Processor: Traffic Monitor
- Processor: Union
- Processor: VXLAN Floodlist
- Configlet Examples (Design)
- play_arrow Apstra CLI Commands
- Apstra EVPN Support Addendum
- Apstra Server Configuration File
- Graph
- Juniper Apstra Technology Preview
-
ON THIS PAGE
Analytics Introduction
Managed devices generate large amounts of data over time. On their own these data are voluminous and unhelpful. With Intent-Based Analytics (IBA) you can combine intent from the graph with current and historic data from devices to reason about the network at-large.
Data generated by devices are ingested via agents and sent to the Apstra server. With the use of probes, data can be aggregated across devices in response to operator configuration. Combining probes with intent from the blueprint graph generates a reduced set of data that can be more easily reasoned about. You can directly inspect advanced data from the Apstra GUI or from REST API to gain real-time insight about the network. It can also be streamed out with our existing streaming infrastructure. Also, based on the state of this advanced data, anomalies can be raised.
While operating IBA at scale, using many probes, disk usage can grow significantly within
the Apstra server VM. This is expected because the system will persist at least enough
samples to maintain data for the requested duration for all time-series for all existing
probes. Additionally, the system will create checkpoint (backup) files up to a
configured limit. Settings in the /etc/aos/aos.conf
file
indicate how often to rotate logs and remove old checkpoint
files. Using IBA can increase disk usage to tens of gigabytes. If this is an issue, you
can adjust the log rotation settings to reduce disk usage.
Additional space may be used by system snapshots and old images from any in-place Apstra server upgrades. These can be deleted or moved off the system to increase free disk space.
Dashboard Analytics Overview
Agents ingest data that devices generate and send them to the Apstra server. With IBA probes, you can aggregate data across devices based on how they are configured. Combining probes with intent from the blueprint graph generates a reduced set of data. You can directly inspect advanced data from the Apstra GUI or from REST API to gain real-time insight about the network. You can stream data out with our existing streaming infrastructure. Also, based on the state of this advanced data, probes can raise anomalies.
While operating IBA at scale, using many probes, disk usage can grow significantly
within the Apstra server VM. This is expected because the system will persist at
least enough samples to maintain data for the requested duration for all time-series
for all existing probes. Additionally, the system will create checkpoint (backup)
files up to a configured limit. Settings in the /etc/aos/aos.conf file
indicate how often to rotate logs and remove old checkpoint files. Using
IBA can increase disk usage to tens of gigabytes. If this is an issue, you can
adjust the log rotation settings to reduce disk usage.
System snapshots and old images from in-place Apstra server upgrades may use additional space. You can delete them or move them off the system to increase free disk space.
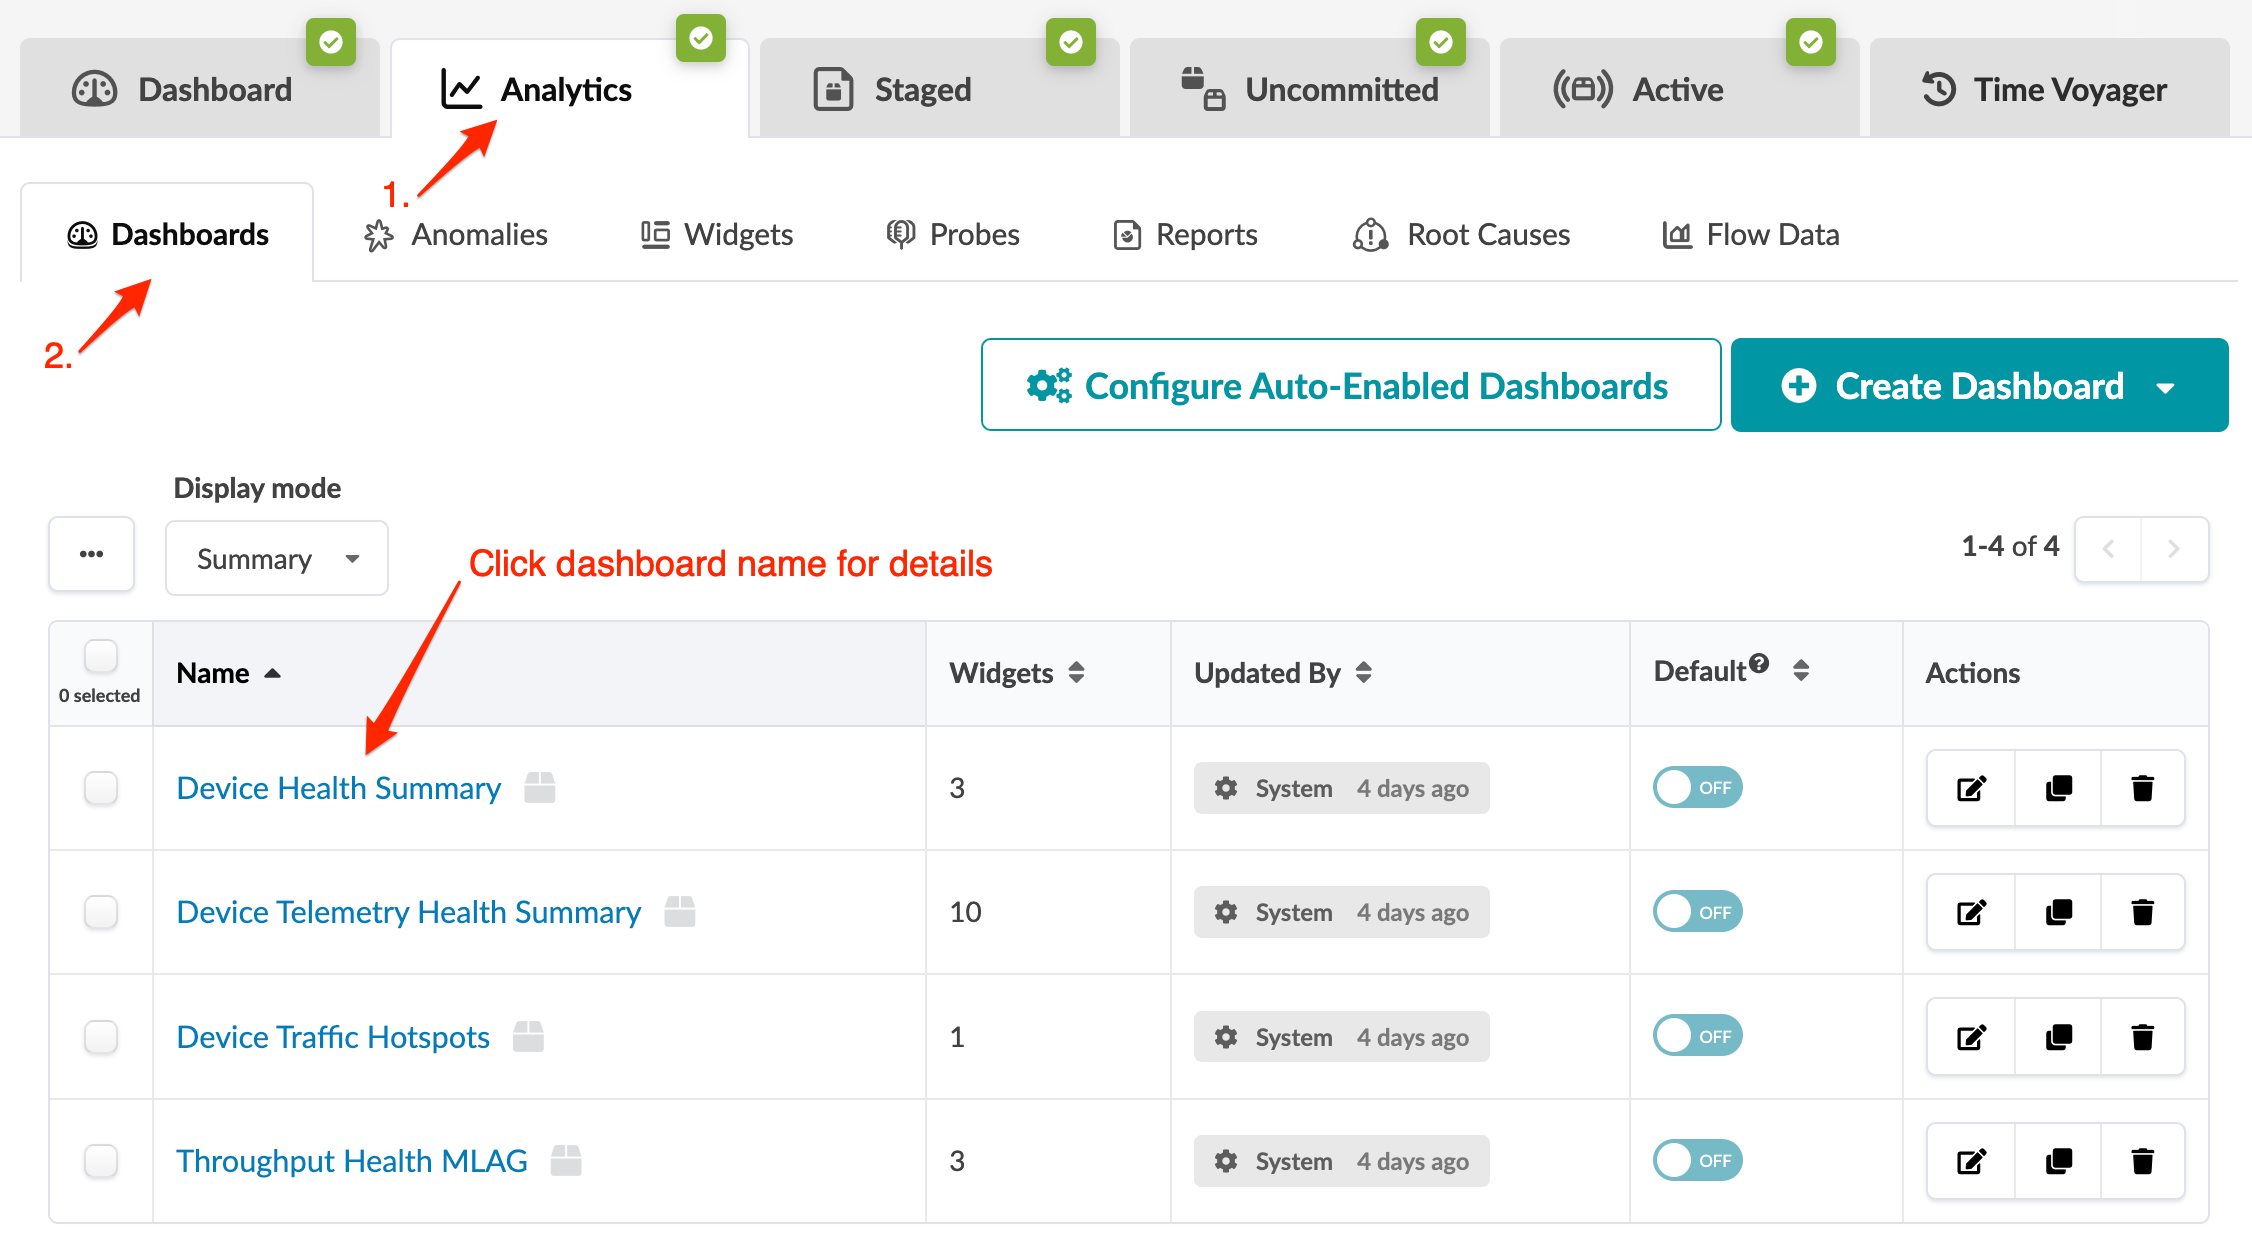
Analytics Dashboard
Analytics dashboards monitor the network and raise alerts to anomalies. Specific dashboards are automatically created and enabled based on the state of the active (operational) blueprint. You can also instantiate predefined dashboards and create your own.
Some other characteristics of analytics dashboards include:
- You cannot configure the trigger logic that determines when dashboards are auto-created, but you can create/instantiate your own dashboards.
- Probes that you've created and not modified are reused instead of creating duplicates of those probes.
- Widgets within each dashboard monitor different aspects of the network and raise alerts to relevant anomalies.
- When you enable a dashboard, the required probes and widgets are instantiated. If you update or delete associated probes and/or widgets, the dashboard may enter an invalid state. Invalid dashboards are not automatically repaired.
- You can display analytics dashboards on the blueprint Blueprint Dashboard to have additional network information on one screen. To add them, turn ON the analytics dashboards' default toggles.
- When upgrading the controller, the auto-creation behavior of dashboards occurs on preexisting active blueprints, in the same way as for newly-created blueprints.
From the blueprint, navigate to Analytics > Dashboards to go to the analytics dashboard. You can create, clone, edit, and delete analytics dashboards. System-generated dashboards are labeled with System and user-generated (and user-modified) dashboards are labeled with the user's name. Select a Display mode (summary, preview, expanded) to view dashboards in various levels of detail. The screenshot below is for Apstra version 4.2.1. Some menu tabs have been renamed, moved, and/or added since Apstra version 4.2.0.